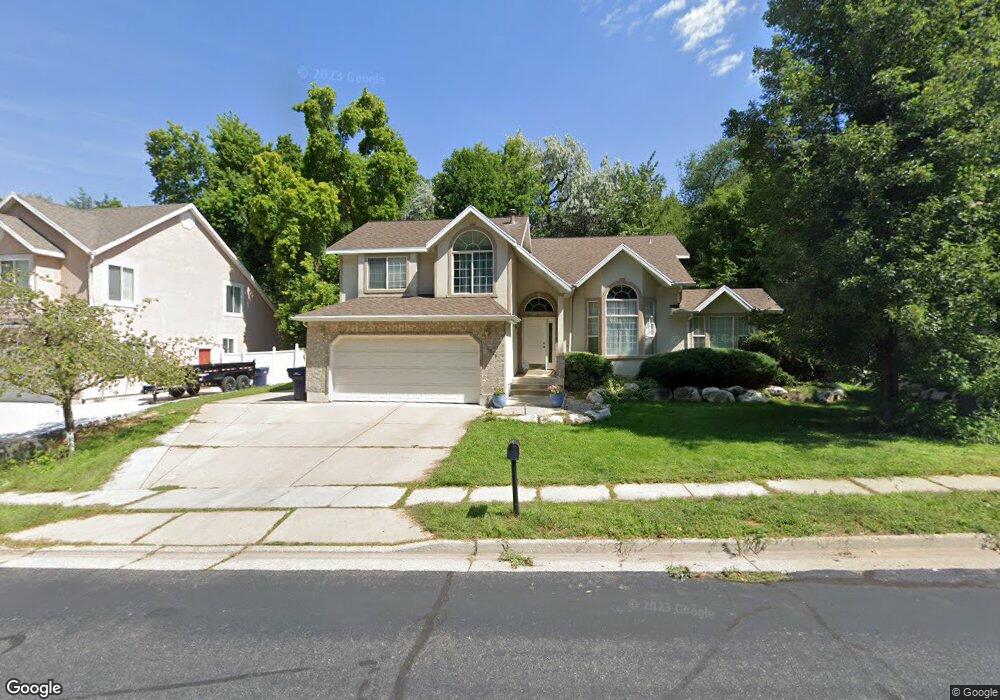
2659 E 1525 N Layton, UT 84040
Estimated Value: $599,156 - $647,000
4
Beds
4
Baths
2,712
Sq Ft
$229/Sq Ft
Est. Value
About This Home
This home is located at 2659 E 1525 N, Layton, UT 84040 and is currently estimated at $620,289, approximately $228 per square foot. 2659 E 1525 N is a home located in Davis County with nearby schools including East Layton Elementary School, Central Davis Junior High School, and Northridge High School.
Ownership History
Date
Name
Owned For
Owner Type
Purchase Details
Closed on
Feb 9, 2018
Sold by
Witte Patsy V
Bought by
Alberts Rachel B
Current Estimated Value
Home Financials for this Owner
Home Financials are based on the most recent Mortgage that was taken out on this home.
Original Mortgage
$201,500
Outstanding Balance
$113,476
Interest Rate
3.99%
Mortgage Type
New Conventional
Estimated Equity
$506,814
Purchase Details
Closed on
Sep 21, 2012
Sold by
Keate Virgil and Keate Sharley E
Bought by
Keate Virgil J and Keate Sharmaine E
Purchase Details
Closed on
Jul 28, 2006
Sold by
Ballard Michael O and Ballard Debra B
Bought by
Keate Virgil and Keate Sharley E
Home Financials for this Owner
Home Financials are based on the most recent Mortgage that was taken out on this home.
Original Mortgage
$228,600
Interest Rate
6.76%
Mortgage Type
Credit Line Revolving
Create a Home Valuation Report for This Property
The Home Valuation Report is an in-depth analysis detailing your home's value as well as a comparison with similar homes in the area
Home Values in the Area
Average Home Value in this Area
Purchase History
| Date | Buyer | Sale Price | Title Company |
|---|---|---|---|
| Alberts Rachel B | -- | Intermountain Title | |
| Keate Virgil J | -- | None Available | |
| Keate Virgil | -- | Bonneville Superior Title Co |
Source: Public Records
Mortgage History
| Date | Status | Borrower | Loan Amount |
|---|---|---|---|
| Open | Alberts Rachel B | $201,500 | |
| Previous Owner | Keate Virgil | $228,600 |
Source: Public Records
Tax History
| Year | Tax Paid | Tax Assessment Tax Assessment Total Assessment is a certain percentage of the fair market value that is determined by local assessors to be the total taxable value of land and additions on the property. | Land | Improvement |
|---|---|---|---|---|
| 2025 | $2,850 | $299,200 | $144,276 | $154,924 |
| 2024 | $2,710 | $286,550 | $164,310 | $122,240 |
| 2023 | $2,768 | $516,000 | $213,922 | $302,078 |
| 2022 | $2,913 | $294,800 | $115,407 | $179,393 |
| 2021 | $2,696 | $407,000 | $176,701 | $230,299 |
| 2020 | $2,444 | $354,000 | $147,366 | $206,634 |
| 2019 | $2,411 | $342,000 | $130,706 | $211,294 |
| 2018 | $2,198 | $313,000 | $105,157 | $207,843 |
| 2016 | $2,014 | $147,950 | $69,739 | $78,211 |
| 2015 | $2,034 | $141,845 | $69,739 | $72,106 |
| 2014 | $2,031 | $144,834 | $69,739 | $75,095 |
| 2013 | -- | $122,465 | $37,055 | $85,410 |
Source: Public Records
Map
Nearby Homes
- 1752 N Valley View Dr
- 2231 N Valley View Dr
- 1870 N Valley View Dr Unit 201
- 1332 N 2350 E
- 2391 Kays Creek Dr
- 2547 E 1900 N
- 2509 E 1900 N
- 1954 N 2600 E
- 2124 E Cherry Ln
- 2855 E Gentile St Unit 1
- 1907 N Bridge Ct
- 2203 E 1200 N
- 2136 N 2800 E
- 2113 E 1200 N
- 1960 N 2150 E
- 1975 E 1425 N
- 2563 E 2250 N
- 1843 Hayes Dr
- 717 Woodridge Dr
- 2340 N 2050 E
- 2641 E 1525 N
- 2641 E 1525 N Unit 805
- 2673 E 1525 N
- 2691 E 1525 N
- 2627 E 1525 N
- 2668 E 1600 N
- 2652 E 1600 N
- 1561 N 2700 E
- 2602 E 1525 N Unit 815
- 2688 E 1600 N
- 2613 E 1525 N
- 2613 E 1525 N Unit 807
- 2705 E 1525 N
- 1485 N 2650 E
- 1479 N 2650 E
- 2638 E 1600 N
- 1491 N 2650 E
- 2595 E 1525 N
- 2723 E 1525 N
- 1564 N 2700 E
Your Personal Tour Guide
Ask me questions while you tour the home.