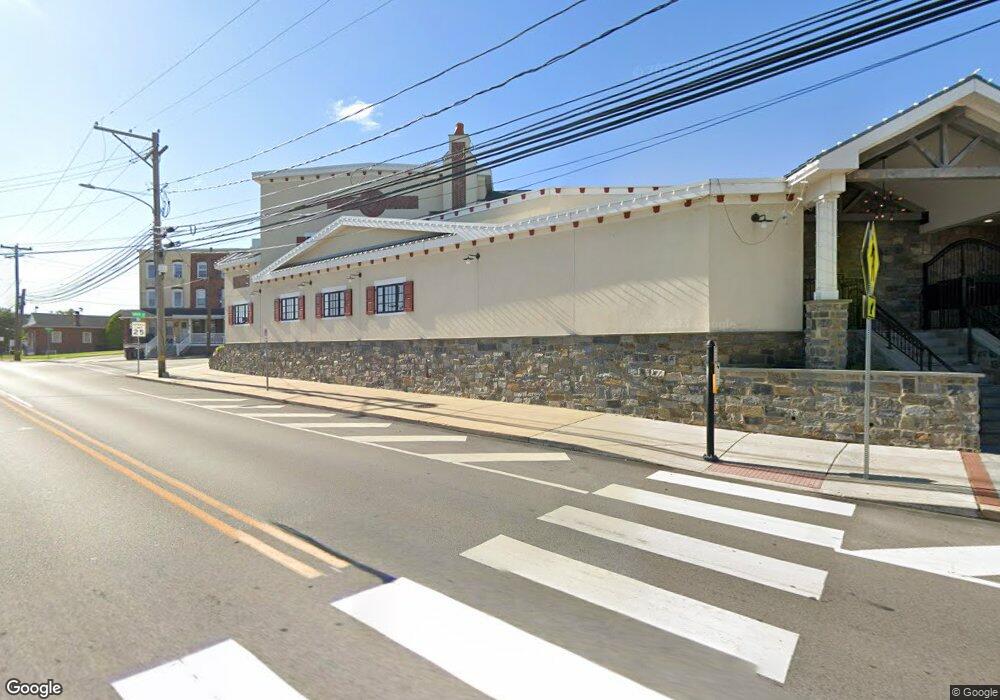
266 E 4th St Bridgeport, PA 19405
--
Bed
1
Bath
8,166
Sq Ft
2,178
Sq Ft Lot
About This Home
This home is located at 266 E 4th St, Bridgeport, PA 19405. 266 E 4th St is a home located in Montgomery County with nearby schools including Bridgeport Elementary School, Upper Merion Middle School, and Upper Merion High School.
Ownership History
Date
Name
Owned For
Owner Type
Purchase Details
Closed on
Feb 1, 2010
Sold by
Gallo Marilyn A and Gallo Frank R
Bought by
Grove Street Gorillas Llc
Home Financials for this Owner
Home Financials are based on the most recent Mortgage that was taken out on this home.
Original Mortgage
$550,000
Outstanding Balance
$365,643
Interest Rate
5.12%
Mortgage Type
Commercial
Purchase Details
Closed on
Mar 16, 2004
Sold by
Gallo Marilyn A and Gallo Frank R
Bought by
Commerce Bank Pa Na
Home Financials for this Owner
Home Financials are based on the most recent Mortgage that was taken out on this home.
Original Mortgage
$360,000
Interest Rate
5.56%
Mortgage Type
Commercial
Create a Home Valuation Report for This Property
The Home Valuation Report is an in-depth analysis detailing your home's value as well as a comparison with similar homes in the area
Home Values in the Area
Average Home Value in this Area
Purchase History
| Date | Buyer | Sale Price | Title Company |
|---|---|---|---|
| Grove Street Gorillas Llc | $450,000 | None Available | |
| Commerce Bank Pa Na | -- | -- |
Source: Public Records
Mortgage History
| Date | Status | Borrower | Loan Amount |
|---|---|---|---|
| Open | Grove Street Gorillas Llc | $550,000 | |
| Previous Owner | Commerce Bank Pa Na | $360,000 |
Source: Public Records
Tax History Compared to Growth
Tax History
| Year | Tax Paid | Tax Assessment Tax Assessment Total Assessment is a certain percentage of the fair market value that is determined by local assessors to be the total taxable value of land and additions on the property. | Land | Improvement |
|---|---|---|---|---|
| 2025 | $7,043 | $178,700 | -- | -- |
| 2024 | $7,043 | $178,700 | -- | -- |
| 2023 | $6,848 | $178,700 | $0 | $0 |
| 2022 | $6,666 | $178,700 | $0 | $0 |
| 2021 | $6,614 | $178,700 | $0 | $0 |
| 2020 | $6,508 | $178,700 | $0 | $0 |
| 2019 | $6,428 | $178,700 | $0 | $0 |
| 2018 | $6,428 | $178,700 | $0 | $0 |
| 2017 | $6,261 | $178,700 | $0 | $0 |
| 2016 | $6,192 | $170,560 | $59,880 | $110,680 |
| 2015 | $5,755 | $170,560 | $59,880 | $110,680 |
| 2014 | $5,755 | $170,560 | $59,880 | $110,680 |
Source: Public Records
Map
Nearby Homes
- 112 E 4th St
- 53 E Front St
- 13 Ford St Unit A
- 13 Ford St Unit B
- 336 Prospect Ave
- 210 Holstein St
- 407 Holstein St
- 19 E Front St
- 7 Ford St Unit A
- 27 Atkins Dr
- 21 Atkins Dr
- 504 Holstein St
- 823 Coates St
- 33 Anderson Dr
- Cambridge Plan at River Pointe - Cambridge Townhomes
- Cambridge Luxe Plan at River Pointe - Cambridge Townhomes
- 530 Grove St
- 532 Bush St
- 45 E Front St
- 57 E Front St