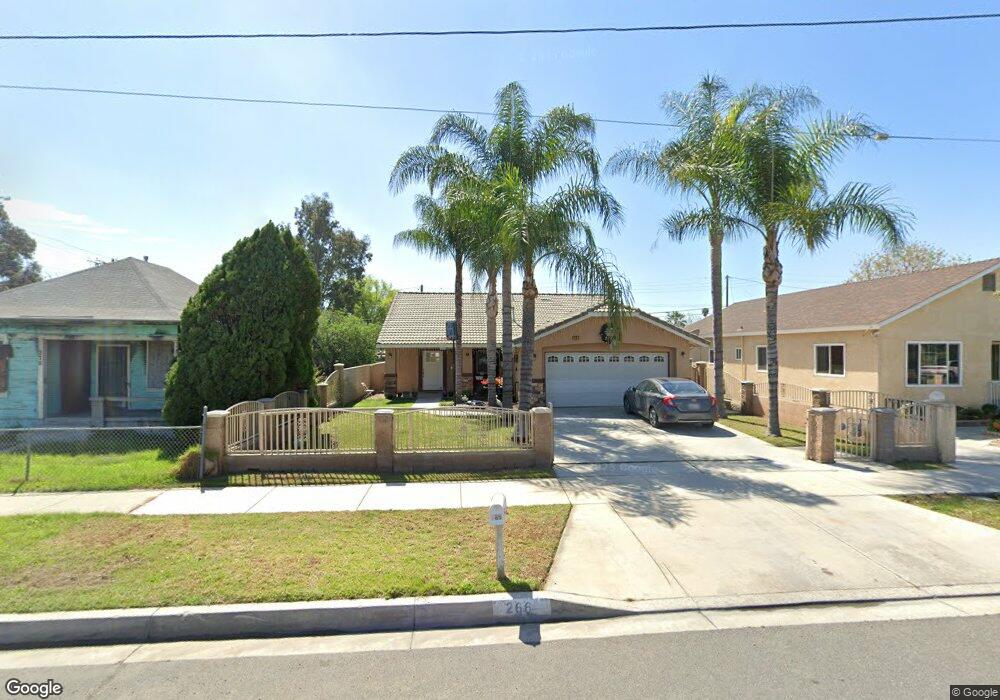
266 E M St Colton, CA 92324
Estimated Value: $473,000 - $626,000
3
Beds
2
Baths
1,536
Sq Ft
$350/Sq Ft
Est. Value
About This Home
This home is located at 266 E M St, Colton, CA 92324 and is currently estimated at $538,264, approximately $350 per square foot. 266 E M St is a home located in San Bernardino County with nearby schools including Woodrow Wilson Elementary School, Terrace Hills Middle School, and Grand Terrace High School.
Ownership History
Date
Name
Owned For
Owner Type
Purchase Details
Closed on
Mar 25, 2008
Sold by
Jara Evelia M
Bought by
Jay Gees Llc
Current Estimated Value
Purchase Details
Closed on
Jul 19, 2001
Sold by
Jara Othoniel and Jara Otoniel
Bought by
Jara Evelia M
Purchase Details
Closed on
Jul 10, 2001
Sold by
Murillo Jose and Murillo Alice Miranda
Bought by
Jara Evelia M
Purchase Details
Closed on
Jun 30, 1995
Sold by
Murillo Jose and Murillo Alice
Bought by
Murillo Jose and Murillo Alice Miranda
Create a Home Valuation Report for This Property
The Home Valuation Report is an in-depth analysis detailing your home's value as well as a comparison with similar homes in the area
Home Values in the Area
Average Home Value in this Area
Purchase History
| Date | Buyer | Sale Price | Title Company |
|---|---|---|---|
| Jay Gees Llc | -- | None Available | |
| Jara Evelia M | -- | Lawyers Title Company | |
| Jara Evelia M | $10,000 | Lawyers Title Company | |
| Murillo Jose | -- | -- |
Source: Public Records
Tax History
| Year | Tax Paid | Tax Assessment Tax Assessment Total Assessment is a certain percentage of the fair market value that is determined by local assessors to be the total taxable value of land and additions on the property. | Land | Improvement |
|---|---|---|---|---|
| 2025 | $5,137 | $413,759 | $124,785 | $288,974 |
| 2024 | $4,899 | $405,646 | $122,338 | $283,308 |
| 2023 | $4,913 | $397,692 | $119,939 | $277,753 |
| 2022 | $4,843 | $389,894 | $117,587 | $272,307 |
| 2021 | $4,443 | $343,600 | $103,000 | $240,600 |
| 2020 | $3,854 | $293,600 | $87,600 | $206,000 |
| 2019 | $3,711 | $285,000 | $85,000 | $200,000 |
| 2018 | $2,611 | $199,700 | $59,800 | $139,900 |
| 2017 | $2,484 | $193,000 | $57,800 | $135,200 |
| 2016 | $2,428 | $180,400 | $54,000 | $126,400 |
| 2015 | $2,210 | $167,000 | $50,000 | $117,000 |
| 2014 | $1,631 | $125,100 | $37,500 | $87,600 |
Source: Public Records
Map
Nearby Homes
Your Personal Tour Guide
Ask me questions while you tour the home.