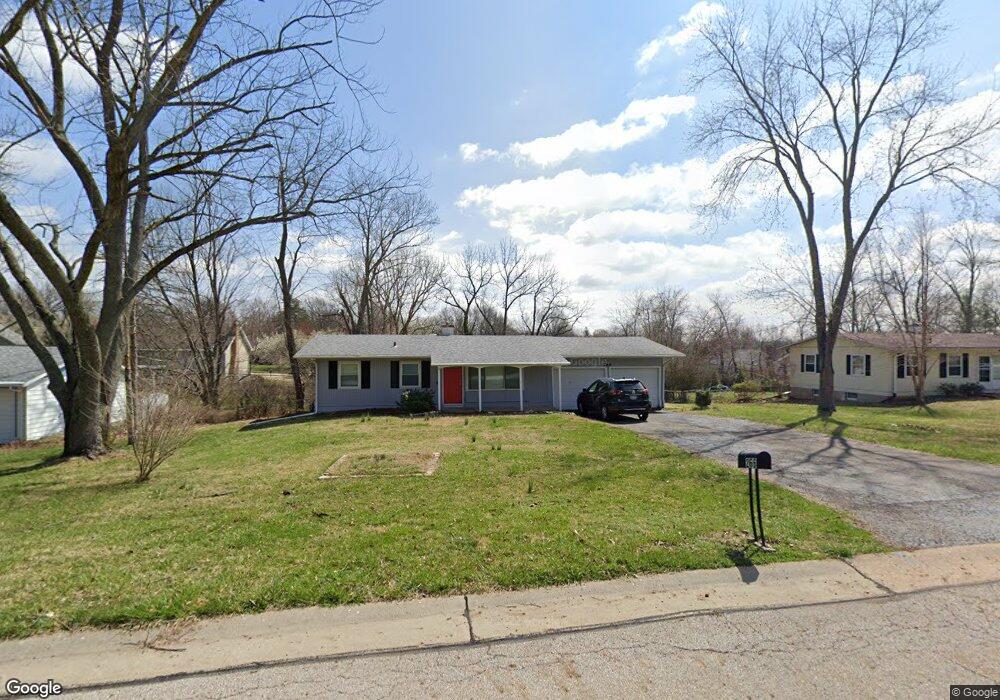
266 E Skyline Dr Ballwin, MO 63011
Estimated Value: $213,000 - $285,000
2
Beds
1
Bath
925
Sq Ft
$262/Sq Ft
Est. Value
About This Home
This home is located at 266 E Skyline Dr, Ballwin, MO 63011 and is currently estimated at $242,498, approximately $262 per square foot. 266 E Skyline Dr is a home located in St. Louis County with nearby schools including Westridge Elementary School, Crestview Middle School, and Marquette Sr. High School.
Ownership History
Date
Name
Owned For
Owner Type
Purchase Details
Closed on
Apr 25, 2012
Sold by
The Sue Ann Freeman Revocable Living Tru
Bought by
Wyatt Patrick Edward
Current Estimated Value
Home Financials for this Owner
Home Financials are based on the most recent Mortgage that was taken out on this home.
Original Mortgage
$98,926
Outstanding Balance
$69,888
Interest Rate
4.4%
Mortgage Type
FHA
Estimated Equity
$172,610
Purchase Details
Closed on
Nov 4, 2010
Sold by
Freeman Sue Ann
Bought by
Freeman Sue Ann and The Sue Ann Freeman Revocable Living Tru
Purchase Details
Closed on
Jul 27, 2000
Sold by
Bucchirie Betty J
Bought by
Freeman Sue Ann
Home Financials for this Owner
Home Financials are based on the most recent Mortgage that was taken out on this home.
Original Mortgage
$73,500
Interest Rate
8.15%
Create a Home Valuation Report for This Property
The Home Valuation Report is an in-depth analysis detailing your home's value as well as a comparison with similar homes in the area
Home Values in the Area
Average Home Value in this Area
Purchase History
| Date | Buyer | Sale Price | Title Company |
|---|---|---|---|
| Wyatt Patrick Edward | $101,500 | Investors Title Co Clayton | |
| Freeman Sue Ann | -- | None Available | |
| Freeman Sue Ann | $98,000 | -- |
Source: Public Records
Mortgage History
| Date | Status | Borrower | Loan Amount |
|---|---|---|---|
| Open | Wyatt Patrick Edward | $98,926 | |
| Previous Owner | Freeman Sue Ann | $73,500 |
Source: Public Records
Tax History
| Year | Tax Paid | Tax Assessment Tax Assessment Total Assessment is a certain percentage of the fair market value that is determined by local assessors to be the total taxable value of land and additions on the property. | Land | Improvement |
|---|---|---|---|---|
| 2025 | $2,708 | $44,690 | $29,930 | $14,760 |
| 2024 | $2,708 | $38,540 | $21,380 | $17,160 |
| 2023 | $2,706 | $38,540 | $21,380 | $17,160 |
| 2022 | $2,524 | $33,360 | $23,520 | $9,840 |
| 2021 | $2,505 | $33,360 | $23,520 | $9,840 |
| 2020 | $2,354 | $29,870 | $17,860 | $12,010 |
| 2019 | $2,364 | $29,870 | $17,860 | $12,010 |
| 2018 | $2,209 | $26,300 | $14,060 | $12,240 |
| 2017 | $2,157 | $26,300 | $14,060 | $12,240 |
| 2016 | $1,770 | $20,700 | $9,960 | $10,740 |
Source: Public Records
Map
Nearby Homes
- 609 Log Hill Ct
- 53 Log Hill Ln
- 239 E Skyline Dr
- 127 Ivy Ct
- 131 Romine Cir
- 807 Portsdown Rd Unit 33D
- 140 Burtonwood Dr
- 351 Greenbriar Ln
- 128 Shadalane Walk Unit A
- 107 Falmouth Dr
- 815 Wendevy Ct Unit 16B
- 222 Dale Ct
- 832 Wendevy Ct Unit 8B
- 842 Wendevy Ct
- 557 Happy Ct
- 835 Lilybud Ct Unit 5C
- 839 Lilybud Ct Unit 5A
- 323 Chipley Cir
- 112 Shirley Ln
- 78 Meadowbrook Country Club Estate
- 264 E Skyline Dr
- 268 E Skyline Dr
- 612 Log Hill Ct
- 616 Log Hill Ct
- 620 Log Hill Ct
- 262 E Skyline Dr
- 608 Log Hill Ct
- 261 E Skyline Dr
- 713 Lindell Dr
- 265 E Skyline Dr
- 260 E Skyline Dr
- 624 Log Hill Ct
- 604 Log Hill Ct
- 272 E Skyline Dr
- 617 Log Hill Ct
- 715 Lindell Dr
- 700 Lindell Dr
- 621 Log Hill Ct
- 629 Log Hill Ct
- 625 Log Hill Ct
Your Personal Tour Guide
Ask me questions while you tour the home.