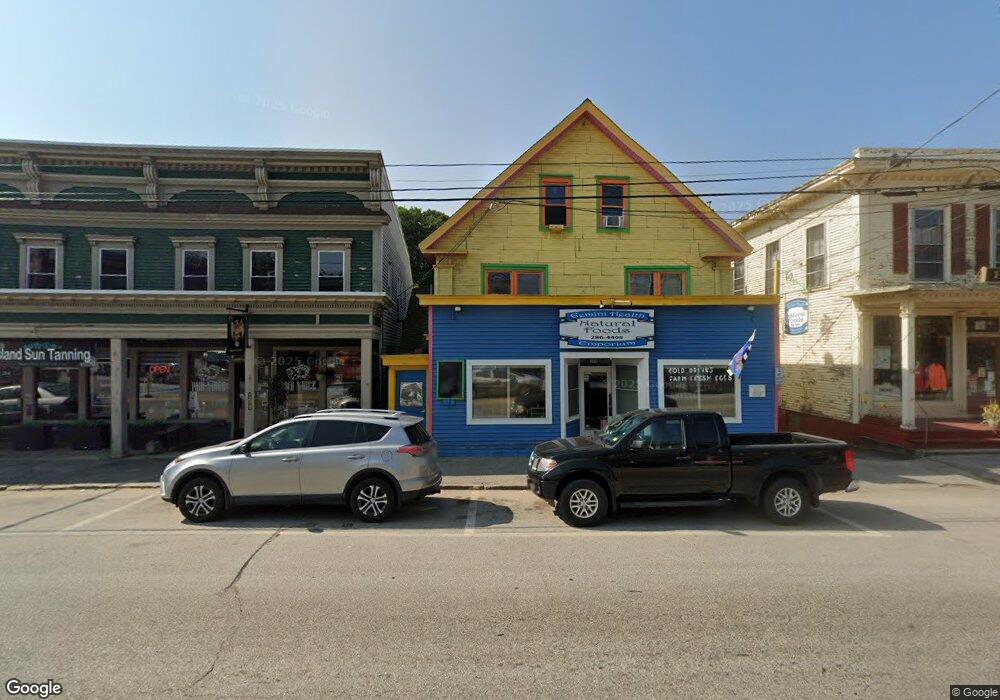
266 Main St Tilton, NH 03276
Tilton NeighborhoodEstimated Value: $464,618
2
Beds
1
Bath
900
Sq Ft
$516/Sq Ft
Est. Value
About This Home
This home is located at 266 Main St, Tilton, NH 03276 and is currently estimated at $464,618, approximately $516 per square foot. 266 Main St is a home located in Belknap County with nearby schools including Union Sanborn School, Southwick School, and Winnisquam Regional Middle School.
Ownership History
Date
Name
Owned For
Owner Type
Purchase Details
Closed on
Jun 6, 2003
Sold by
Matty Larry and Matty Georgeann
Bought by
Sapere Llc
Current Estimated Value
Home Financials for this Owner
Home Financials are based on the most recent Mortgage that was taken out on this home.
Original Mortgage
$116,250
Outstanding Balance
$51,108
Interest Rate
5.83%
Mortgage Type
Commercial
Estimated Equity
$413,510
Create a Home Valuation Report for This Property
The Home Valuation Report is an in-depth analysis detailing your home's value as well as a comparison with similar homes in the area
Home Values in the Area
Average Home Value in this Area
Purchase History
| Date | Buyer | Sale Price | Title Company |
|---|---|---|---|
| Sapere Llc | $155,000 | -- |
Source: Public Records
Mortgage History
| Date | Status | Borrower | Loan Amount |
|---|---|---|---|
| Open | Sapere Llc | $116,250 |
Source: Public Records
Tax History Compared to Growth
Tax History
| Year | Tax Paid | Tax Assessment Tax Assessment Total Assessment is a certain percentage of the fair market value that is determined by local assessors to be the total taxable value of land and additions on the property. | Land | Improvement |
|---|---|---|---|---|
| 2024 | $4,038 | $373,900 | $168,500 | $205,400 |
| 2023 | $2,563 | $144,700 | $39,000 | $105,700 |
| 2022 | $2,325 | $144,700 | $39,000 | $105,700 |
| 2021 | $2,366 | $144,600 | $39,000 | $105,600 |
| 2020 | $2,671 | $144,600 | $39,000 | $105,600 |
| 2019 | $2,836 | $144,600 | $39,000 | $105,600 |
| 2018 | $3,455 | $128,400 | $35,800 | $92,600 |
| 2017 | $3,409 | $128,400 | $35,800 | $92,600 |
| 2016 | $3,400 | $164,100 | $71,500 | $92,600 |
| 2015 | $3,769 | $164,100 | $71,500 | $92,600 |
| 2014 | $3,267 | $164,100 | $71,500 | $92,600 |
| 2013 | $3,307 | $180,700 | $60,400 | $120,300 |
| 2012 | $3,298 | $180,700 | $60,400 | $120,300 |
Source: Public Records
Map
Nearby Homes
- 9 High St
- 12 Holmes Ave
- 22 Cedar St
- 18 Pine St
- 12 Kimball St
- 124 E Main St
- 24 Morrison Ave
- 495 W Main St
- R02-13 Calef Hill Rd
- 32 Bean Hill Rd
- 9 Aspen Rd
- 0 Clark Rd Unit 7-1 5058307
- 44 Fellows Hill Rd
- 50 Diana Dr
- 1 Marsh Hill Cir
- 195 Zion Hill Rd
- 12 Foothills Way
- 12 Village Way Unit 38
- 39 Village Way Unit 21
- 22 Stonehenge Cir Unit 7