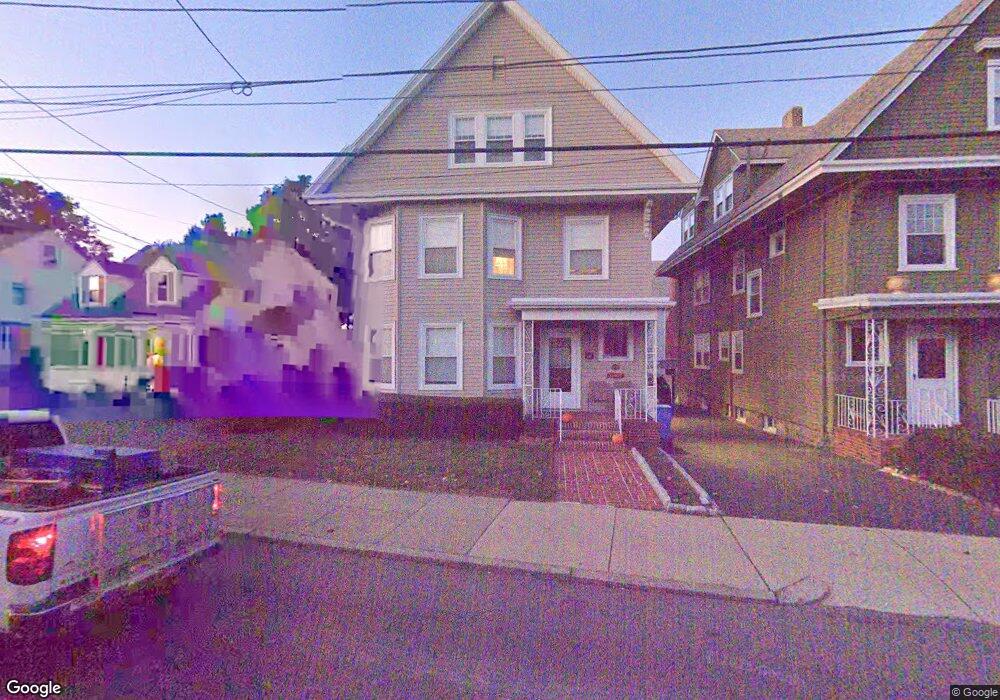
266 Main St Unit 1 Winthrop, MA 02152
Downtown Winthrop NeighborhoodEstimated Value: $637,000 - $935,000
3
Beds
1
Bath
99,999
Sq Ft
$8/Sq Ft
Est. Value
About This Home
This home is located at 266 Main St Unit 1, Winthrop, MA 02152 and is currently estimated at $795,115, approximately $7 per square foot. 266 Main St Unit 1 is a home located in Suffolk County with nearby schools including William P. Gorman/Fort Banks Elementary School, Arthur T. Cummings Elementary School, and Winthrop Middle School.
Ownership History
Date
Name
Owned For
Owner Type
Purchase Details
Closed on
Nov 4, 2020
Sold by
266 Main Street T
Bought by
Brace Susan L and Limone Richard P
Current Estimated Value
Home Financials for this Owner
Home Financials are based on the most recent Mortgage that was taken out on this home.
Original Mortgage
$384,750
Outstanding Balance
$342,987
Interest Rate
2.9%
Mortgage Type
New Conventional
Estimated Equity
$452,128
Purchase Details
Closed on
Dec 26, 2013
Sold by
Limone Richard C and Limone Lucille M
Bought by
266 Main Street T
Home Financials for this Owner
Home Financials are based on the most recent Mortgage that was taken out on this home.
Original Mortgage
$232,225
Interest Rate
4.35%
Mortgage Type
New Conventional
Purchase Details
Closed on
May 5, 2006
Sold by
Limone Lucille M and Limone Richard C
Bought by
Limone Richard P and Brace Susan L
Create a Home Valuation Report for This Property
The Home Valuation Report is an in-depth analysis detailing your home's value as well as a comparison with similar homes in the area
Home Values in the Area
Average Home Value in this Area
Purchase History
| Date | Buyer | Sale Price | Title Company |
|---|---|---|---|
| Brace Susan L | $513,000 | None Available | |
| 266 Main Street T | -- | -- | |
| Limone Richard C | -- | -- | |
| Limone Richard P | -- | -- |
Source: Public Records
Mortgage History
| Date | Status | Borrower | Loan Amount |
|---|---|---|---|
| Open | Brace Susan L | $384,750 | |
| Previous Owner | Limone Richard C | $232,225 |
Source: Public Records
Tax History Compared to Growth
Tax History
| Year | Tax Paid | Tax Assessment Tax Assessment Total Assessment is a certain percentage of the fair market value that is determined by local assessors to be the total taxable value of land and additions on the property. | Land | Improvement |
|---|---|---|---|---|
| 2025 | $7,433 | $720,300 | $308,500 | $411,800 |
| 2024 | $7,351 | $705,500 | $296,500 | $409,000 |
| 2023 | $7,582 | $708,600 | $271,400 | $437,200 |
| 2022 | $7,992 | $679,600 | $242,400 | $437,200 |
| 2021 | $7,829 | $617,400 | $216,500 | $400,900 |
| 2020 | $7,120 | $564,200 | $216,500 | $347,700 |
| 2019 | $6,844 | $519,300 | $199,500 | $319,800 |
| 2018 | $6,754 | $477,000 | $171,200 | $305,800 |
| 2017 | $6,319 | $438,500 | $155,000 | $283,500 |
| 2016 | $6,171 | $401,500 | $132,000 | $269,500 |
| 2015 | $5,382 | $375,300 | $128,100 | $247,200 |
| 2014 | $5,542 | $355,700 | $114,100 | $241,600 |
Source: Public Records
Map
Nearby Homes
- 426 Winthrop St
- 441 Winthrop St
- 9 Atlantic St Unit 2
- 50-52 Wilshire St
- 87 Hermon St
- 800 Governors Dr Unit 6
- 1100 Governors Dr Unit 6
- 800 Governors Dr Unit 30
- 1000 Governors Dr Unit 25
- 9 Marshall St
- 80 Shirley St
- 19 Pleasant Park Rd
- 14 Pleasant Park Rd
- 41 Summit Ave
- 34 Fremont St
- 174 Winthrop St Unit 2
- 70 Edgehill Rd
- 56 Main St
- 130 Shirley St Unit 204
- 130 Shirley St Unit 202
- 266 Main St
- 260 Main St
- 270 Main St
- 270 Main St Unit 3
- 16 Wilshire St
- 254 Main St
- 278 Main St
- 255 Main St
- 20 Wilshire St Unit 2
- 20 Wilshire St Unit 1
- 20 Wilshire St
- 9 Wilshire St
- 9 Wilshire St Unit 1
- 263 Main St
- 263 Main St Unit 1
- 15 Banks St
- 15 Wilshire St
- 15 Wilshire St Unit 1
- 269 Main St
- 275 Main St