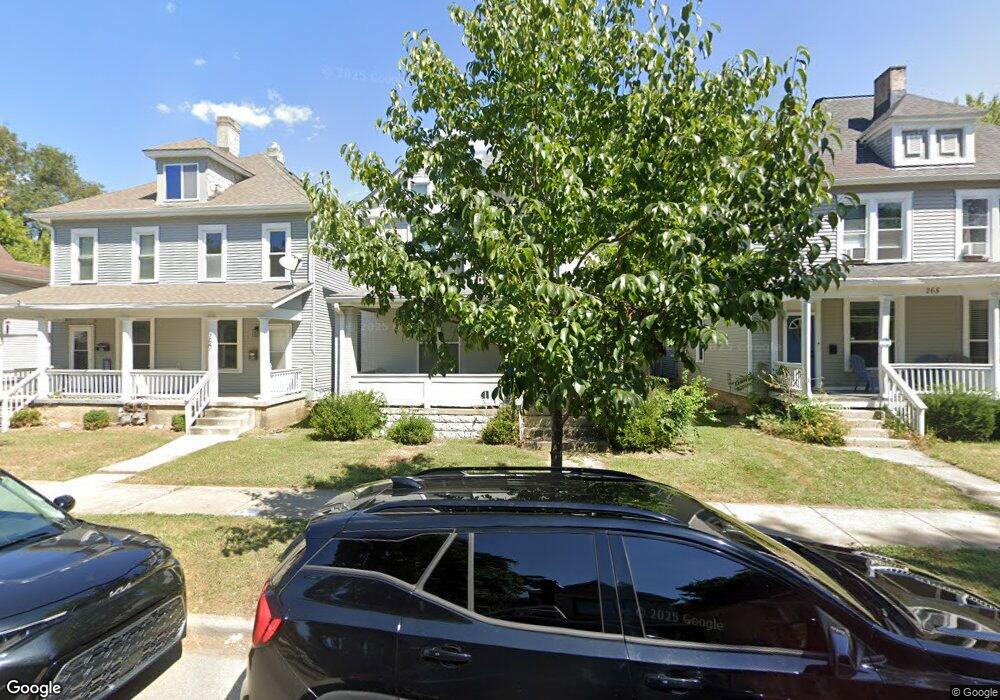
266 S Souder Ave Columbus, OH 43222
Franklinton NeighborhoodEstimated Value: $310,000 - $338,000
4
Beds
3
Baths
2,065
Sq Ft
$157/Sq Ft
Est. Value
About This Home
This home is located at 266 S Souder Ave, Columbus, OH 43222 and is currently estimated at $323,560, approximately $156 per square foot. 266 S Souder Ave is a home located in Franklin County with nearby schools including Sullivant Elementary School, Starling PK-8, and West High School.
Ownership History
Date
Name
Owned For
Owner Type
Purchase Details
Closed on
Aug 22, 2024
Sold by
Scroggy Morgan L and Patterson Amy
Bought by
266 Souder Rental Llc
Current Estimated Value
Purchase Details
Closed on
Nov 4, 2019
Sold by
266 Souder Real Estate Holdings Llc
Bought by
Scroggy Morgan L
Home Financials for this Owner
Home Financials are based on the most recent Mortgage that was taken out on this home.
Original Mortgage
$237,500
Interest Rate
3.6%
Mortgage Type
New Conventional
Purchase Details
Closed on
Jan 31, 2018
Sold by
Cosmic Homes Llc
Bought by
266 Souder Real Estate Holdings Llc
Purchase Details
Closed on
Jul 19, 2010
Sold by
Burman Harry A and Burman Nancy E
Bought by
Burman Nancy E
Purchase Details
Closed on
Jul 11, 2010
Sold by
Burman Nancy E and Burman Harry A
Bought by
Cosmic Homes Llc
Purchase Details
Closed on
Jul 28, 2003
Sold by
Burman Harry A
Bought by
Burman Harry A and Burman Nancy E
Purchase Details
Closed on
Mar 13, 1992
Bought by
Burman Harry A
Create a Home Valuation Report for This Property
The Home Valuation Report is an in-depth analysis detailing your home's value as well as a comparison with similar homes in the area
Home Values in the Area
Average Home Value in this Area
Purchase History
| Date | Buyer | Sale Price | Title Company |
|---|---|---|---|
| 266 Souder Rental Llc | -- | None Listed On Document | |
| Scroggy Morgan L | $250,000 | None Available | |
| 266 Souder Real Estate Holdings Llc | $40,000 | Expedient Title Ltd | |
| Burman Nancy E | -- | Attorney | |
| Cosmic Homes Llc | -- | Attorney | |
| Burman Harry A | -- | -- | |
| Burman Harry A | $2,700 | -- |
Source: Public Records
Mortgage History
| Date | Status | Borrower | Loan Amount |
|---|---|---|---|
| Previous Owner | Scroggy Morgan L | $237,500 |
Source: Public Records
Tax History Compared to Growth
Tax History
| Year | Tax Paid | Tax Assessment Tax Assessment Total Assessment is a certain percentage of the fair market value that is determined by local assessors to be the total taxable value of land and additions on the property. | Land | Improvement |
|---|---|---|---|---|
| 2024 | $4,607 | $102,660 | $7,350 | $95,310 |
| 2023 | $4,548 | $102,655 | $7,350 | $95,305 |
| 2022 | $4,190 | $80,790 | $1,440 | $79,350 |
| 2021 | $4,198 | $80,790 | $1,440 | $79,350 |
| 2020 | $4,203 | $80,790 | $1,440 | $79,350 |
| 2019 | $1,075 | $17,290 | $1,190 | $16,100 |
| 2018 | $884 | $17,290 | $1,190 | $16,100 |
| 2017 | $1,075 | $17,290 | $1,190 | $16,100 |
| 2016 | $764 | $11,240 | $1,680 | $9,560 |
| 2015 | $695 | $11,240 | $1,680 | $9,560 |
| 2014 | $697 | $11,240 | $1,680 | $9,560 |
| 2013 | $381 | $12,460 | $1,855 | $10,605 |
Source: Public Records
Map
Nearby Homes
- 772 Sullivant Ave Unit 772
- 791 Campbell Ave
- 955 Sullivant Ave
- 286 Avondale Ave
- 378 Hawkes Ave
- 760 Thomas Ave
- 186 Avondale Ave Unit 188
- 273 Avondale Ave
- 642 Sullivant Ave Unit 642
- The Summit Plan at Homes on Hartford - Single Family
- 1011 Sullivant Ave
- 78 Hawkes Ave
- 45 N Hartford Ave
- 975 Campbell Ave Unit 975
- 0 Campbell Ave
- 601 W Rich St Unit 601
- 49 S Hartford Ave
- 45 S Hartford Ave
- 345 Dakota Ave
- 211 Dakota Ave
- 258 S Souder Ave Unit 260
- 268-270 S Souder Ave
- 258-260 S Souder Ave
- 268 S Souder Ave Unit 270
- 274 S Souder Ave
- 252 S Souder Ave
- 278 S Souder Ave
- 0 S Souder Ave
- 248 S Souder Ave
- 817 W Rich St
- 809 W Rich St Unit 811
- 809-811 W Rich St
- 286 S Souder Ave Unit 288
- 269 S Davis Ave
- 271 S Davis Ave Unit 273
- 805 W Rich St
- 277-279 S Souder Ave
- 263 S Souder Ave
- 821-829 W Rich St
- 267 S Souder Ave