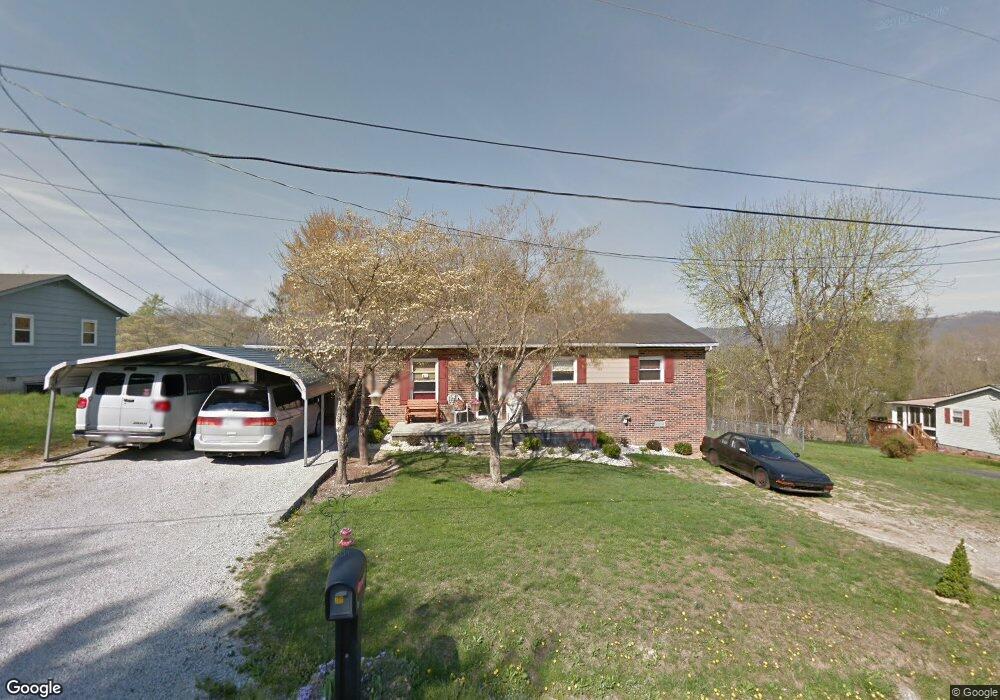
266 Vinsant Estates Rd Jacksboro, TN 37757
Estimated Value: $170,740 - $289,000
--
Bed
2
Baths
1,296
Sq Ft
$181/Sq Ft
Est. Value
About This Home
This home is located at 266 Vinsant Estates Rd, Jacksboro, TN 37757 and is currently estimated at $234,685, approximately $181 per square foot. 266 Vinsant Estates Rd is a home located in Campbell County.
Ownership History
Date
Name
Owned For
Owner Type
Purchase Details
Closed on
Nov 8, 1993
Bought by
Bracher Jeffery L and Bracher Melinda G
Current Estimated Value
Purchase Details
Closed on
Feb 4, 1983
Bought by
Hunley Gary E and Hunley Sheila
Purchase Details
Closed on
Nov 19, 1982
Purchase Details
Closed on
Sep 11, 1981
Purchase Details
Closed on
Jan 2, 1981
Purchase Details
Closed on
Jan 1, 1981
Purchase Details
Closed on
Mar 7, 1977
Create a Home Valuation Report for This Property
The Home Valuation Report is an in-depth analysis detailing your home's value as well as a comparison with similar homes in the area
Home Values in the Area
Average Home Value in this Area
Purchase History
| Date | Buyer | Sale Price | Title Company |
|---|---|---|---|
| Bracher Jeffery L | $48,900 | -- | |
| Hunley Gary E | -- | -- | |
| -- | -- | -- | |
| -- | -- | -- | |
| -- | $32,700 | -- | |
| -- | $33,000 | -- | |
| -- | -- | -- |
Source: Public Records
Tax History Compared to Growth
Tax History
| Year | Tax Paid | Tax Assessment Tax Assessment Total Assessment is a certain percentage of the fair market value that is determined by local assessors to be the total taxable value of land and additions on the property. | Land | Improvement |
|---|---|---|---|---|
| 2024 | $356 | $29,300 | $7,125 | $22,175 |
| 2023 | $311 | $15,050 | $3,225 | $11,825 |
| 2022 | $311 | $15,050 | $3,225 | $11,825 |
| 2021 | $311 | $15,050 | $3,225 | $11,825 |
| 2020 | $305 | $15,050 | $3,225 | $11,825 |
| 2019 | $311 | $15,050 | $3,225 | $11,825 |
| 2018 | $331 | $14,725 | $3,050 | $11,675 |
| 2017 | $331 | $14,725 | $3,050 | $11,675 |
| 2016 | $331 | $14,725 | $3,050 | $11,675 |
| 2015 | $293 | $14,725 | $3,050 | $11,675 |
| 2014 | $293 | $14,725 | $3,050 | $11,675 |
| 2013 | -- | $14,725 | $3,050 | $11,675 |
Source: Public Records
Map
Nearby Homes
- 264 Cypress Ln
- 0 McGhee Ln Unit 1316190
- 1517 Towe String Rd
- 241 Cumberland View Dr
- 452 Clover Cir
- 115 Queener St
- 205 Hickory Ln
- 204 Queener St
- 107 Bertha Ln
- 0 Indian River Boat Dock Rd
- 110 Cumberland Overlook Ln
- 0 Dogwood Ln
- 1327 Pinecrest Rd
- 165 Gamble Dr
- 2527 Jacksboro Pike
- 1658 Pinecrest Rd
- 896 Shawnee Dr
- 0 Storm Ln Unit 1307847
- 119 Colonial Heights
- 149 Island Ford Rd
- 274 Vinsant Estates Rd
- 254 Vinsant Estates Rd
- 279 Vinsant Estates Rd
- 249 Vinsant Estates Rd
- 233 Vinsant Estates Rd
- 206 Vinsant Estates Rd
- 307 Vinsant Estates Rd
- 295 Vinsant Estates Rd
- 227 Vinsant Estates Rd
- 215 Vinsant Estates Rd
- 350 Vinsant Estates Rd
- 0 Joy Ln
- 1129 Towe String Rd
- 1129 Towe String Rd
- 157 Vinsant Estates Rd
- 1089 Towe String Rd
- 451 Pinecrest Rd
- 154 Vinsant Estates Rd
- 154 Vinsant Estates Rd
- 343 Cedar Lodge Ln