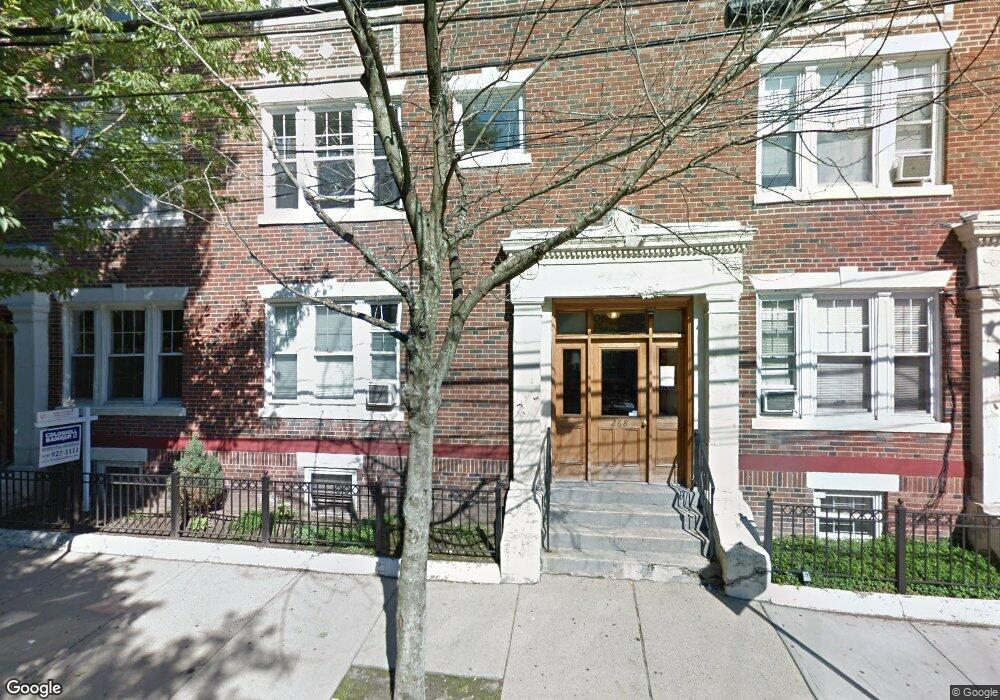
266 Windsor St Unit 2 Cambridge, MA 02139
The Port NeighborhoodEstimated Value: $674,000 - $764,201
3
Beds
1
Bath
9,999
Sq Ft
$73/Sq Ft
Est. Value
About This Home
This home is located at 266 Windsor St Unit 2, Cambridge, MA 02139 and is currently estimated at $733,050, approximately $73 per square foot. 266 Windsor St Unit 2 is a home located in Middlesex County with nearby schools including Prospect Hill Academy Charter School and Community Charter School of Cambridge.
Ownership History
Date
Name
Owned For
Owner Type
Purchase Details
Closed on
Oct 31, 2003
Sold by
Kim Carla F and Kim Charles H
Bought by
Truong Trieu P and Truong Trieu
Current Estimated Value
Home Financials for this Owner
Home Financials are based on the most recent Mortgage that was taken out on this home.
Original Mortgage
$263,900
Interest Rate
6.05%
Mortgage Type
Purchase Money Mortgage
Purchase Details
Closed on
Aug 29, 2002
Sold by
Steinbergh Alex M and Stanley Bowden R
Bought by
Kim Charles H and Kim Carla F
Home Financials for this Owner
Home Financials are based on the most recent Mortgage that was taken out on this home.
Original Mortgage
$246,400
Interest Rate
6.55%
Mortgage Type
Purchase Money Mortgage
Purchase Details
Closed on
May 28, 1998
Sold by
Thatcher Hanne
Bought by
Steinbergh Alex M and Stanley Bowden R
Create a Home Valuation Report for This Property
The Home Valuation Report is an in-depth analysis detailing your home's value as well as a comparison with similar homes in the area
Home Values in the Area
Average Home Value in this Area
Purchase History
| Date | Buyer | Sale Price | Title Company |
|---|---|---|---|
| Truong Trieu P | $329,900 | -- | |
| Truong Trieu P | $329,900 | -- | |
| Kim Charles H | $308,000 | -- | |
| Kim Charles H | $308,000 | -- | |
| Steinbergh Alex M | $30,000 | -- |
Source: Public Records
Mortgage History
| Date | Status | Borrower | Loan Amount |
|---|---|---|---|
| Open | Steinbergh Alex M | $223,000 | |
| Closed | Truong Trieu P | $263,900 | |
| Previous Owner | Kim Charles H | $246,400 |
Source: Public Records
Tax History Compared to Growth
Tax History
| Year | Tax Paid | Tax Assessment Tax Assessment Total Assessment is a certain percentage of the fair market value that is determined by local assessors to be the total taxable value of land and additions on the property. | Land | Improvement |
|---|---|---|---|---|
| 2025 | $3,755 | $591,300 | $0 | $591,300 |
| 2024 | $3,421 | $577,800 | $0 | $577,800 |
| 2023 | $3,384 | $577,500 | $0 | $577,500 |
| 2022 | $3,371 | $569,400 | $0 | $569,400 |
| 2021 | $3,299 | $564,000 | $0 | $564,000 |
| 2020 | $3,213 | $558,800 | $0 | $558,800 |
| 2019 | $3,076 | $517,800 | $0 | $517,800 |
| 2018 | $2,985 | $474,600 | $0 | $474,600 |
| 2017 | $2,810 | $433,000 | $0 | $433,000 |
| 2016 | $2,692 | $385,100 | $0 | $385,100 |
| 2015 | $2,634 | $336,800 | $0 | $336,800 |
| 2014 | $2,534 | $302,400 | $0 | $302,400 |
Source: Public Records
Map
Nearby Homes
- 294-302 Windsor St
- 94 Hampshire St Unit B
- 222 Columbia St Unit 2
- 51 Market St Unit 2
- 63 Bristol St Unit 63
- 63 Plymouth St
- 350 Windsor St Unit 1
- 350 Windsor St Unit 2
- 350 Windsor St
- 30 Union St Unit 1
- 66 Elm St
- 114 Elm St
- 208 Windsor St
- 161 Columbia St Unit 3
- 182 Harvard St Unit 3
- 244 Norfolk St Unit 244
- 308 Broadway Unit 308
- 28 Berkshire St
- 43 Lincoln St
- 17 York Place Unit 1
- 266 Windsor St Unit B
- 266 Windsor St Unit 3
- 266 Windsor St Unit 1
- 270 Windsor St Unit 6
- 270 Windsor St Unit 5
- 270 Windsor St Unit 4
- 270 Windsor St Unit 3
- 270 Windsor St Unit 2
- 270 Windsor St Unit 1
- 264 Windsor St Unit 2
- 264 Windsor St Unit 2T
- 264 Windsor St Unit 2A
- 268 Windsor St Unit 5
- 268 Windsor St Unit 4
- 268 Windsor St Unit 3
- 268 Windsor St Unit 2
- 268 Windsor St Unit 1
- 268 Windsor St
- 268 Windsor St Unit STREERT
- 276 Windsor St