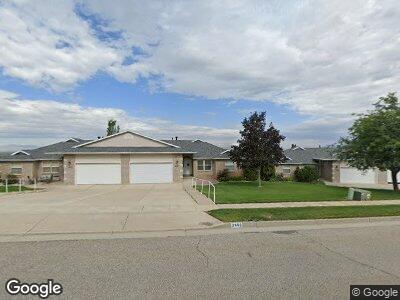
2660 Peach St Unit 11 Brigham City, UT 84302
Three Mile Creek NeighborhoodEstimated Value: $434,000 - $487,000
4
Beds
3
Baths
2,614
Sq Ft
$173/Sq Ft
Est. Value
About This Home
This home is located at 2660 Peach St Unit 11, Brigham City, UT 84302 and is currently estimated at $452,477, approximately $173 per square foot. 2660 Peach St Unit 11 is a home located in Box Elder County with nearby schools including Three Mile Creek School, Adele C. Young Intermediate School, and Box Elder Middle School.
Ownership History
Date
Name
Owned For
Owner Type
Purchase Details
Closed on
Jul 2, 2020
Sold by
Clark Parley K and Clark Linda K
Bought by
Patty Robert M and Patty Kathryn L
Current Estimated Value
Home Financials for this Owner
Home Financials are based on the most recent Mortgage that was taken out on this home.
Original Mortgage
$232,000
Interest Rate
3.2%
Mortgage Type
New Conventional
Purchase Details
Closed on
Nov 29, 2018
Sold by
Harper Sheila I
Bought by
Clark Parley K and Clark Linda K
Home Financials for this Owner
Home Financials are based on the most recent Mortgage that was taken out on this home.
Original Mortgage
$180,600
Interest Rate
4.62%
Mortgage Type
Adjustable Rate Mortgage/ARM
Purchase Details
Closed on
May 16, 2017
Sold by
Harper Sheila I and Hagerup Reba L
Bought by
Hagerup Reba L and Harper Sheila I
Create a Home Valuation Report for This Property
The Home Valuation Report is an in-depth analysis detailing your home's value as well as a comparison with similar homes in the area
Home Values in the Area
Average Home Value in this Area
Purchase History
| Date | Buyer | Sale Price | Title Company |
|---|---|---|---|
| Patty Robert M | -- | Hickman Land Title Logan | |
| Clark Parley K | -- | First American American Fork | |
| Hagerup Reba L | -- | None Available |
Source: Public Records
Mortgage History
| Date | Status | Borrower | Loan Amount |
|---|---|---|---|
| Open | Patty Robert M | $260,000 | |
| Closed | Patty Robert M | $232,000 | |
| Previous Owner | Clark Parley K | $180,600 |
Source: Public Records
Tax History Compared to Growth
Tax History
| Year | Tax Paid | Tax Assessment Tax Assessment Total Assessment is a certain percentage of the fair market value that is determined by local assessors to be the total taxable value of land and additions on the property. | Land | Improvement |
|---|---|---|---|---|
| 2024 | $2,252 | $405,795 | $90,000 | $315,795 |
| 2023 | $2,214 | $405,271 | $80,000 | $325,271 |
| 2022 | $2,494 | $235,751 | $27,500 | $208,251 |
| 2021 | $2,051 | $264,127 | $50,000 | $214,127 |
| 2020 | $1,766 | $264,127 | $50,000 | $214,127 |
| 2019 | $2,105 | $167,982 | $27,500 | $140,482 |
| 2018 | $1,984 | $149,658 | $27,500 | $122,158 |
| 2017 | $2,083 | $272,105 | $27,500 | $222,105 |
| 2016 | $2,058 | $143,841 | $27,500 | $116,341 |
| 2015 | $1,875 | $133,264 | $27,500 | $105,764 |
| 2014 | $1,875 | $128,229 | $5,869 | $122,360 |
| 2013 | -- | $117,105 | $5,869 | $111,236 |
Source: Public Records
Map
Nearby Homes
- 2550 Peach St
- 3250 S Highway 89
- 2732 S 820 W
- 2805 S Orchard Hill Ln
- 2801 S Orchard Hill Ln
- 995 W 2650 S
- 2253 S 385 W
- 2925 S Highway 89 Unit 10
- 2925 S Highway 89 Unit 7
- 2925 S Highway 89 Unit 5
- 2925 S Highway 89 Unit 3
- 2230 S 635 W Unit B
- 2230 S 635 W Unit A
- 2223 S 300 W
- 2980 S Highway 89
- 1145 W 2520 S
- 682 W 2200 S
- 470 W 2100 S
- 2975 S 1080 W
- 420 W 2000 S Unit 8