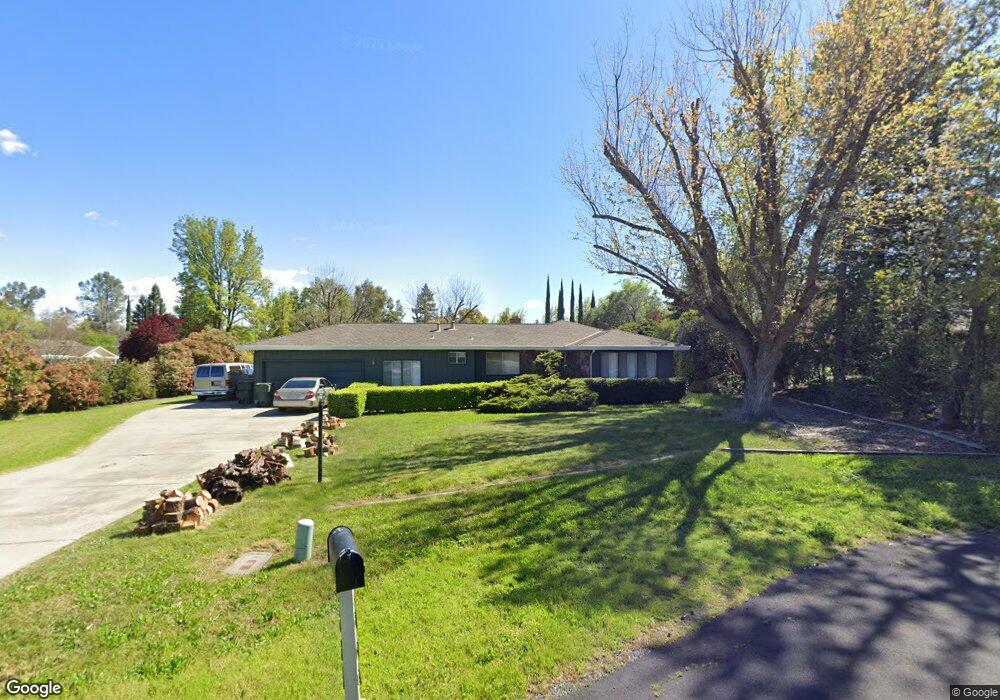
2660 Saddletree Ln Rocklin, CA 95677
Sunset Whitney NeighborhoodEstimated Value: $490,000 - $777,924
4
Beds
3
Baths
2,170
Sq Ft
$295/Sq Ft
Est. Value
About This Home
This home is located at 2660 Saddletree Ln, Rocklin, CA 95677 and is currently estimated at $639,731, approximately $294 per square foot. 2660 Saddletree Ln is a home located in Placer County with nearby schools including Antelope Creek Elementary School, Spring View Middle School, and Whitney High.
Ownership History
Date
Name
Owned For
Owner Type
Purchase Details
Closed on
Sep 10, 2002
Sold by
Storm Enoch and Storm Beth Ann
Bought by
Storm Enoch M and Storm Beth Ann
Current Estimated Value
Home Financials for this Owner
Home Financials are based on the most recent Mortgage that was taken out on this home.
Original Mortgage
$170,000
Outstanding Balance
$71,688
Interest Rate
6.37%
Mortgage Type
Purchase Money Mortgage
Estimated Equity
$568,043
Purchase Details
Closed on
Apr 9, 1999
Sold by
Enoch M Jr & Beth Ann Storm Revocable Tr
Bought by
Storm Enoch M and Storm Beth Ann
Purchase Details
Closed on
Jan 11, 1999
Sold by
Storm Enoch M and Storm Enoch Maynard
Bought by
Storm Enoch M and Storm Beth Ann
Home Financials for this Owner
Home Financials are based on the most recent Mortgage that was taken out on this home.
Original Mortgage
$110,000
Interest Rate
6.63%
Mortgage Type
Stand Alone First
Purchase Details
Closed on
Jan 13, 1998
Sold by
Storm Elfriede A and Storm Eric J
Bought by
Storm Enoch M and Storm Beth A
Create a Home Valuation Report for This Property
The Home Valuation Report is an in-depth analysis detailing your home's value as well as a comparison with similar homes in the area
Home Values in the Area
Average Home Value in this Area
Purchase History
| Date | Buyer | Sale Price | Title Company |
|---|---|---|---|
| Storm Enoch M | -- | Financial Title Company | |
| Storm Enoch M | -- | -- | |
| Storm Enoch M | -- | -- | |
| Storm Enoch M | $100,000 | -- |
Source: Public Records
Mortgage History
| Date | Status | Borrower | Loan Amount |
|---|---|---|---|
| Open | Storm Enoch M | $170,000 | |
| Previous Owner | Storm Enoch M | $110,000 |
Source: Public Records
Tax History Compared to Growth
Tax History
| Year | Tax Paid | Tax Assessment Tax Assessment Total Assessment is a certain percentage of the fair market value that is determined by local assessors to be the total taxable value of land and additions on the property. | Land | Improvement |
|---|---|---|---|---|
| 2025 | $4,101 | $378,960 | $97,519 | $281,441 |
| 2023 | $4,101 | $364,246 | $93,733 | $270,513 |
| 2022 | $3,967 | $357,105 | $91,896 | $265,209 |
| 2021 | $3,923 | $350,104 | $90,095 | $260,009 |
| 2020 | $3,917 | $346,515 | $89,172 | $257,343 |
| 2019 | $3,862 | $339,722 | $87,424 | $252,298 |
| 2018 | $3,762 | $333,061 | $85,710 | $247,351 |
| 2017 | $3,765 | $326,531 | $84,030 | $242,501 |
| 2016 | $3,658 | $320,130 | $82,383 | $237,747 |
| 2015 | $3,612 | $315,322 | $81,146 | $234,176 |
| 2014 | $3,548 | $309,146 | $79,557 | $229,589 |
Source: Public Records
Map
Nearby Homes
- 2446 Pinnacles Dr
- 3023 Twin Creeks Ln
- 2645 S Whitney Blvd
- 2649 S Whitney Blvd
- 5922 Allan Dr
- 2685 S Whitney Blvd
- 6511 Hearthstone Cir Unit 312
- 5742 Shannon Bay Dr
- 2586 Pinnacles Dr
- 5636 Butano Way
- 6315 Hemlock Way
- 5615 Casa Grande Ave
- 6545 Woodcrest Ct
- 5401 Casa Grande Ave
- 3645 Amethyst Dr
- 3540 Farron St
- 5810 Elmwood Ct
- 1501 Secret Ravine Pkwy Unit 430
- 1501 Secret Ravine Pkwy Unit 526
- 1501 Secret Ravine Pkwy Unit 326
- 2620 Saddletree Ln
- 2700 Saddletree Ln
- 2705 Saddletree Ln
- 2625 Saddletree Ln
- 6360 Rainier Ave
- 6162 Springview Dr
- 6158 Springview Dr
- 2665 Saddletree Ln
- 6166 Springview Dr
- 6154 Springview Dr
- 2745 Saddletree Ln
- 2916 Christopher Ct
- 6170 Springview Dr
- 2909 Christopher Ct
- 2450 Casa Del Oro Way
- 6400 Rainier Ave
- 2460 Casa Del Oro Way
- 2905 Christopher Ct
- 6325 Rainier Ave
- 2912 Christopher Ct