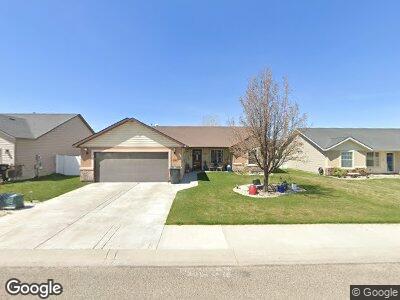
2660 Yukon Trail Burley, ID 83318
Estimated Value: $331,834 - $351,000
3
Beds
2
Baths
1,454
Sq Ft
$234/Sq Ft
Est. Value
About This Home
This home is located at 2660 Yukon Trail, Burley, ID 83318 and is currently estimated at $340,709, approximately $234 per square foot. 2660 Yukon Trail is a home located in Cassia County with nearby schools including Mountain View Elementary School, White Pine Elementary School, and Burley Junior High School.
Ownership History
Date
Name
Owned For
Owner Type
Purchase Details
Closed on
Sep 6, 2022
Sold by
Willis Yoshida Samuel
Bought by
Brown Della K
Current Estimated Value
Purchase Details
Closed on
Sep 1, 2022
Sold by
Brown Della K and Brown Jerry D
Bought by
Brown Della K and Yoshida Jeneal C
Purchase Details
Closed on
Mar 9, 2011
Sold by
Brown Jerry D and Brown Della K
Bought by
Brown Jerry D
Home Financials for this Owner
Home Financials are based on the most recent Mortgage that was taken out on this home.
Original Mortgage
$237,000
Interest Rate
5.02%
Mortgage Type
Reverse Mortgage Home Equity Conversion Mortgage
Purchase Details
Closed on
Mar 1, 2010
Sold by
Severe Juanita L
Bought by
Brown Jerry D and Brown Della K
Purchase Details
Closed on
Apr 27, 2009
Sold by
James Ray Inc
Bought by
Severe Juanita L
Home Financials for this Owner
Home Financials are based on the most recent Mortgage that was taken out on this home.
Original Mortgage
$109,520
Interest Rate
5.02%
Mortgage Type
New Conventional
Create a Home Valuation Report for This Property
The Home Valuation Report is an in-depth analysis detailing your home's value as well as a comparison with similar homes in the area
Home Values in the Area
Average Home Value in this Area
Purchase History
| Date | Buyer | Sale Price | Title Company |
|---|---|---|---|
| Brown Della K | -- | -- | |
| Brown Jerry D | -- | -- | |
| Brown Jerry D | -- | -- | |
| Severe Juanita L | -- | Land Title And Escrow | |
| James Ray Inc | -- | Land Title And Escrow |
Source: Public Records
Mortgage History
| Date | Status | Borrower | Loan Amount |
|---|---|---|---|
| Previous Owner | Brown Jerry D | $237,000 | |
| Previous Owner | Brown Jerry D | $0 | |
| Previous Owner | Severe Juanita L | $109,520 |
Source: Public Records
Tax History Compared to Growth
Tax History
| Year | Tax Paid | Tax Assessment Tax Assessment Total Assessment is a certain percentage of the fair market value that is determined by local assessors to be the total taxable value of land and additions on the property. | Land | Improvement |
|---|---|---|---|---|
| 2024 | $1,646 | $329,938 | $74,950 | $254,988 |
| 2023 | $1,725 | $329,938 | $74,950 | $254,988 |
| 2022 | $1,620 | $276,051 | $59,960 | $216,091 |
| 2021 | $1,520 | $217,610 | $44,415 | $173,195 |
| 2020 | $1,461 | $190,343 | $42,325 | $148,018 |
| 2019 | $1,423 | $183,021 | $39,930 | $143,091 |
| 2017 | $1,341 | $165,984 | $36,300 | $129,684 |
| 2016 | $1,303 | $162,207 | $36,300 | $125,907 |
| 2015 | $1,280 | $158,907 | $33,000 | $125,907 |
| 2014 | $1,268 | $159,859 | $33,000 | $126,859 |
| 2013 | $1,268 | $159,859 | $33,000 | $126,859 |
Source: Public Records
Map
Nearby Homes
- 2643 Yellowstone Trail
- 2344 S Yellowstone Trail
- 2403 Yellowstone Trail
- 2640 Grand Canyon Dr
- 2603 Denali Dr
- 2400 Boardwalk Ct
- 2755 Fairmont Dr
- 262 Ferdinand Cir
- 544 W 24th St
- 730 Clear Springs St
- 407 Page Cir
- 435 W 24th St
- 550 Clear Springs St
- 2313 Conant Dr
- 2059 Burton Ave
- 425 W 20th St
- 1900 Yale Ave
- 2138 Oakley Ave
- 2240 Overland Ave
- 201 E 27th St
- 2660 Yukon Trail
- 2652 Yukon Trail
- 2445 Great Basin Way
- 2644 Yukon Trail
- 1065 Zion St
- 1066 Zion St
- 2620 Yukon Trail
- 1049 Zion St
- 2430 Great Basin Way
- 1050 Zion St
- 2436 Yukon Trail
- 2643 Yukon Trail
- 2319 Yukon Trail
- 1033 Zion St
- 2428 Great Basin Way
- 2635 Yukon Trail
- 1034 Zion St
- 2428 Yukon Trail
- 2627 Yukon Trail
- 2619 Yukon Trail