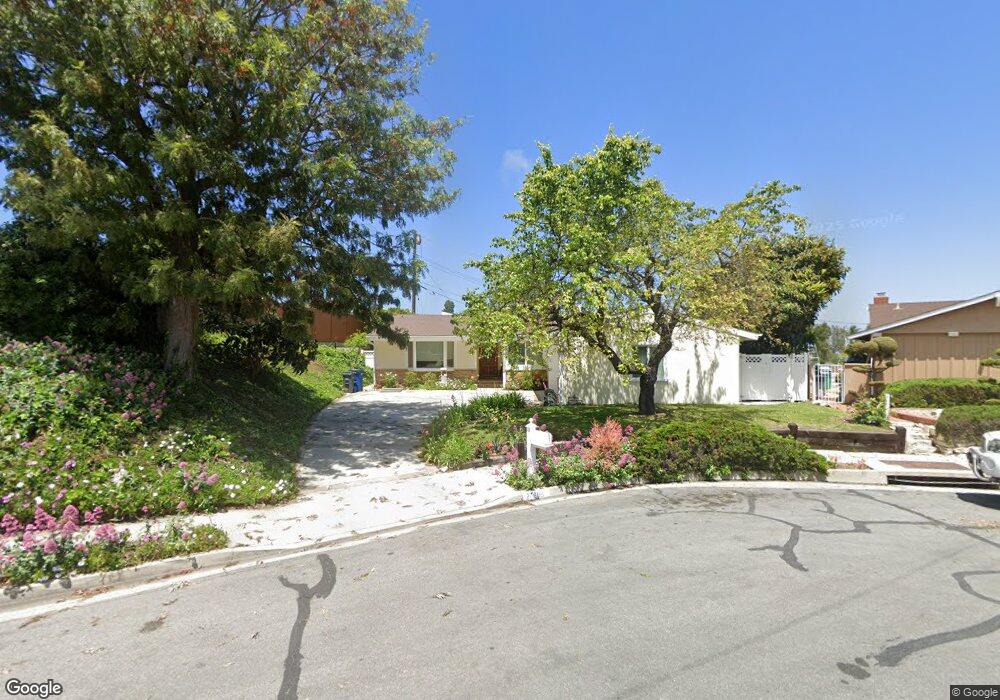
26609 Menominee Place Rancho Palos Verdes, CA 90275
Estimated Value: $1,804,000 - $2,160,000
4
Beds
3
Baths
2,210
Sq Ft
$899/Sq Ft
Est. Value
About This Home
This home is located at 26609 Menominee Place, Rancho Palos Verdes, CA 90275 and is currently estimated at $1,986,606, approximately $898 per square foot. 26609 Menominee Place is a home located in Los Angeles County with nearby schools including Montemalaga Elementary School, Palos Verdes Intermediate School, and Palos Verdes Peninsula High School.
Ownership History
Date
Name
Owned For
Owner Type
Purchase Details
Closed on
May 3, 2025
Sold by
Tom Paul J and Tom Catherine Y
Bought by
Paul & Catherine Family Trust and Tom
Current Estimated Value
Purchase Details
Closed on
Sep 24, 2003
Sold by
Pao Wu Pen and Pao Hetty K
Bought by
Tom Paul J and Tom Catherine Y
Home Financials for this Owner
Home Financials are based on the most recent Mortgage that was taken out on this home.
Original Mortgage
$322,700
Interest Rate
5.98%
Mortgage Type
Purchase Money Mortgage
Purchase Details
Closed on
Jun 22, 1998
Sold by
Pao Wu Pen
Bought by
Pao Ya De Kuei
Purchase Details
Closed on
Mar 7, 1997
Sold by
Chang John H and Chang Katherine S
Bought by
Pao Wu Pen and Pao Ya De Kuei
Home Financials for this Owner
Home Financials are based on the most recent Mortgage that was taken out on this home.
Original Mortgage
$320,000
Interest Rate
6.12%
Create a Home Valuation Report for This Property
The Home Valuation Report is an in-depth analysis detailing your home's value as well as a comparison with similar homes in the area
Home Values in the Area
Average Home Value in this Area
Purchase History
| Date | Buyer | Sale Price | Title Company |
|---|---|---|---|
| Paul & Catherine Family Trust | -- | None Listed On Document | |
| Tom Paul J | $780,000 | Ticor Title Co | |
| Pao Ya De Kuei | -- | Fidelity Title | |
| Pao Wu Pen | $452,000 | Chicago Title Insurance |
Source: Public Records
Mortgage History
| Date | Status | Borrower | Loan Amount |
|---|---|---|---|
| Previous Owner | Tom Paul J | $322,700 | |
| Previous Owner | Pao Wu Pen | $320,000 | |
| Closed | Tom Paul J | $100,000 |
Source: Public Records
Tax History Compared to Growth
Tax History
| Year | Tax Paid | Tax Assessment Tax Assessment Total Assessment is a certain percentage of the fair market value that is determined by local assessors to be the total taxable value of land and additions on the property. | Land | Improvement |
|---|---|---|---|---|
| 2025 | $12,921 | $1,108,978 | $887,189 | $221,789 |
| 2024 | $12,921 | $1,087,235 | $869,794 | $217,441 |
| 2023 | $12,645 | $1,065,918 | $852,740 | $213,178 |
| 2022 | $12,014 | $1,045,019 | $836,020 | $208,999 |
| 2021 | $12,026 | $1,024,529 | $819,628 | $204,901 |
| 2019 | $11,506 | $994,142 | $795,318 | $198,824 |
| 2018 | $11,377 | $974,650 | $779,724 | $194,926 |
| 2016 | $10,810 | $936,805 | $749,448 | $187,357 |
| 2015 | $10,804 | $922,734 | $738,191 | $184,543 |
| 2014 | $10,663 | $904,660 | $723,731 | $180,929 |
Source: Public Records
Map
Nearby Homes
- 6039 Via Sonoma
- 1300 Granvia Altamira
- 5508 Ironwood St
- 2457 Via Sonoma
- 2521 Novato Place
- 1133 Granvia Altamira
- 1325 Via Gabriel
- 27032 Freeport Rd
- 26326 Birchfield Ave
- 702 Via la Cuesta
- 27056 Shorewood Rd
- 26228 Birchfield Ave
- 5 Yellow Brick Rd
- 2229 Via Cerritos
- 58 Hilltop Cir
- 5718 Ravenspur Dr Unit 307
- 5700 Ravenspur Dr Unit 107
- 5644 Ravenspur Dr
- 2708 Via Elevado
- 2205 Via la Brea
- 5911 Birchmont Dr
- 26603 Menominee Place
- 5919 Birchmont Dr
- 5905 Birchmont Dr
- 26605 Grayslake Rd
- 26606 Menominee Place
- 26602 Menominee Place
- 26611 Grayslake Rd
- 26614 Menominee Place
- 26608 Lightfoot Place
- 26617 Grayslake Rd
- 26706 Grayslake Rd
- 26600 Menominee Place
- 26620 Menominee Place
- 26705 Menominee Place
- 26625 Grayslake Rd
- 26614 Lightfoot Place
- 26704 Menominee Place
- 26600 Lightfoot Place
- 26631 Grayslake Rd