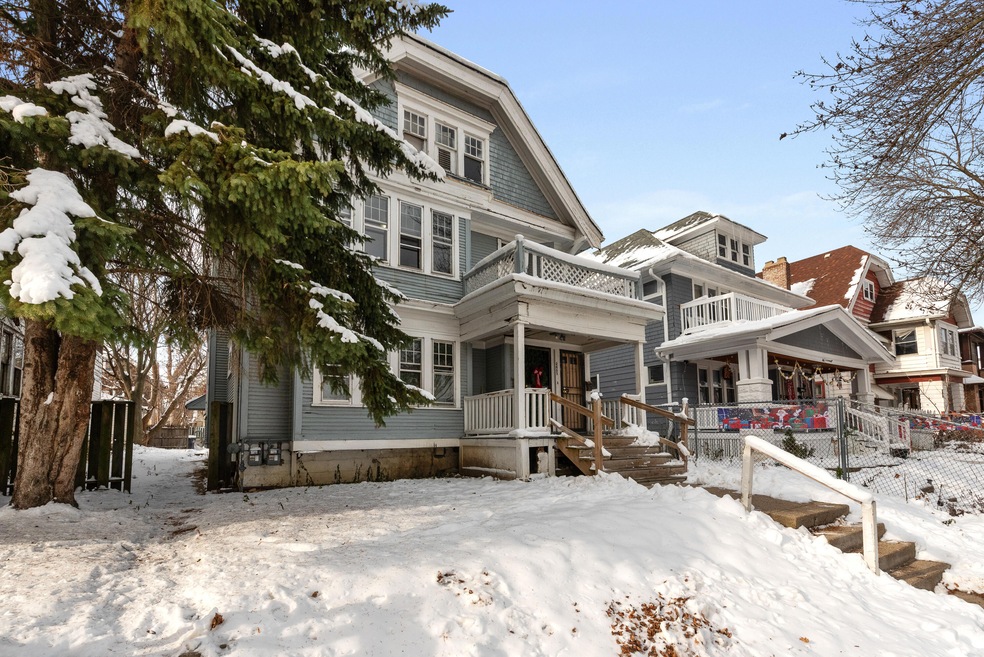

2661 N 39th St Unit 2663 Milwaukee, WI 53210
Sherman Park NeighborhoodEstimated payment $1,003/month
About This Home
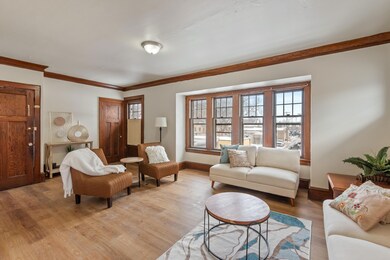
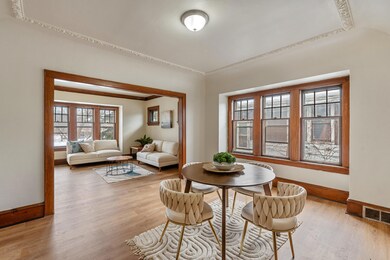
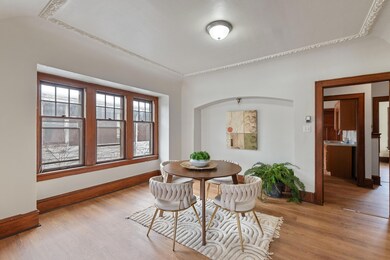
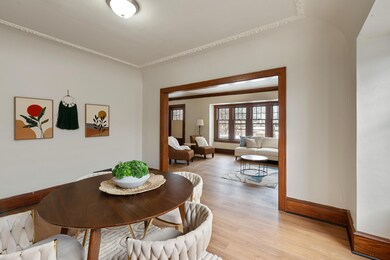
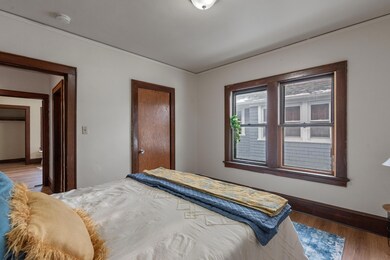
Welcome home to this 2/2 duplex perfect for investors or an owner occupant. Both units have been renovated with LVP flooring, fresh paint, new kitchen cabinets and counter tops, and updated bathrooms. The upper unit is currently vacant and ready for an owner-occupant or new tenant, while the lower unit is rented for $995 MTM. Don't miss outschedule your showing today!
Property Details
Property Type
- Other
Est. Annual Taxes
- $1,648
Lot Details
- 4,792 Sq Ft Lot
- Property fronts an alley
Parking
- 2 Car Detached Garage
Interior Spaces
- 2,469 Sq Ft Home
Basement
- Basement Fills Entire Space Under The House
- Block Basement Construction
Community Details
- 2 Units
Listing and Financial Details
- Exclusions: staging items, tenants personal property
- The owner pays for water
- Assessor Parcel Number 3271381000
Map
Home Values in the Area
Average Home Value in this Area
Tax History
| Year | Tax Paid | Tax Assessment Tax Assessment Total Assessment is a certain percentage of the fair market value that is determined by local assessors to be the total taxable value of land and additions on the property. | Land | Improvement |
|---|---|---|---|---|
| 2024 | $1,648 | $69,800 | $3,400 | $66,400 |
| 2023 | $1,326 | $56,100 | $3,400 | $52,700 |
| 2022 | $1,362 | $56,100 | $3,400 | $52,700 |
| 2021 | $1,336 | $49,700 | $3,100 | $46,600 |
| 2020 | $2,894 | $49,700 | $3,100 | $46,600 |
| 2019 | $2,764 | $39,500 | $3,200 | $36,300 |
| 2018 | $2,480 | $39,500 | $3,200 | $36,300 |
| 2017 | $1,644 | $31,600 | $3,400 | $28,200 |
| 2016 | $2,389 | $34,800 | $3,400 | $31,400 |
| 2015 | -- | $38,900 | $3,400 | $35,500 |
| 2014 | -- | $38,900 | $3,400 | $35,500 |
| 2013 | -- | $45,700 | $3,400 | $42,300 |
Property History
| Date | Event | Price | List to Sale | Price per Sq Ft | Prior Sale |
|---|---|---|---|---|---|
| 12/06/2025 12/06/25 | For Sale | $165,000 | +73.7% | $67 / Sq Ft | |
| 07/02/2025 07/02/25 | Sold | $95,000 | 0.0% | $38 / Sq Ft | View Prior Sale |
| 06/17/2025 06/17/25 | Pending | -- | -- | -- | |
| 05/28/2025 05/28/25 | For Sale | $95,000 | -- | $38 / Sq Ft |
Purchase History
| Date | Type | Sale Price | Title Company |
|---|---|---|---|
| Warranty Deed | $95,000 | None Listed On Document | |
| Warranty Deed | $57,000 | None Available | |
| Warranty Deed | $38,000 | Merit Title |
Mortgage History
| Date | Status | Loan Amount | Loan Type |
|---|---|---|---|
| Open | $95,000 | New Conventional |
Source: Metro MLS
MLS Number: 1944711
APN: 327-1381-000-1
Disclaimer: Certain information contained herein is derived from information provided by parties other than Homes.com. All information provided is deemed reliable, but is not guaranteed to be accurate and should be independently verified.
![]() IDX information is provided exclusively for personal, non-commercial use, and may not be used for any purpose other than to identify prospective properties consumers may be interested in purchasing.
IDX information is provided exclusively for personal, non-commercial use, and may not be used for any purpose other than to identify prospective properties consumers may be interested in purchasing.
IDX listing data provided by Multiple Listing Service, Inc. Information is supplied by seller and other third parties and has not been verified.
Copyright 2025 – Multiple Listing Service, Inc. – All Rights Reserved.
- 2607 N 40th St Unit 2609
- 2677 N 39th St Unit 2679
- 2677 N 40th St
- 2701 N 39th St
- 2735 N 39th St Unit 2737
- 2761 N 39th St Unit 2763
- 3813 W Wright St
- 2770 N 39th St Unit 2772
- 2771 N 40th St Unit 2773
- 2530 N 37th St
- 3615 W Center St
- 2476 N 38th St
- 2469 N 37th St
- 2444 N 38th St
- 2438 N 38th St
- 2553 N 35th St
- 2422 N 40th St Unit 2424
- 2421 N 40th St Unit 2423
- 2523 N 35th St
- 2519 N 35th St
- 2608 N 40th St Unit 2608a
- 2572 N 41st St
- 2574 N 41st St
- 2566 N 41st St
- 2575 N 34th St Unit Upper
- 2853 N Sherman Blvd Unit 2
- 3100 W Center St
- 2322 N 44th St
- 3412 W Fond du Lac Ave
- 2146 N 40th St Unit Upper
- 3155 N 42nd St
- 2800 W Wright St
- 2530 N 28th St
- 3940 W Lisbon Ave
- 2325 N 50th St
- 2219 N 29th St Unit 2219a
- 2776 N 53rd St Unit Upper
- 2481 W Locust St
- 2478 W Chambers St
- 2626 N 24th St
