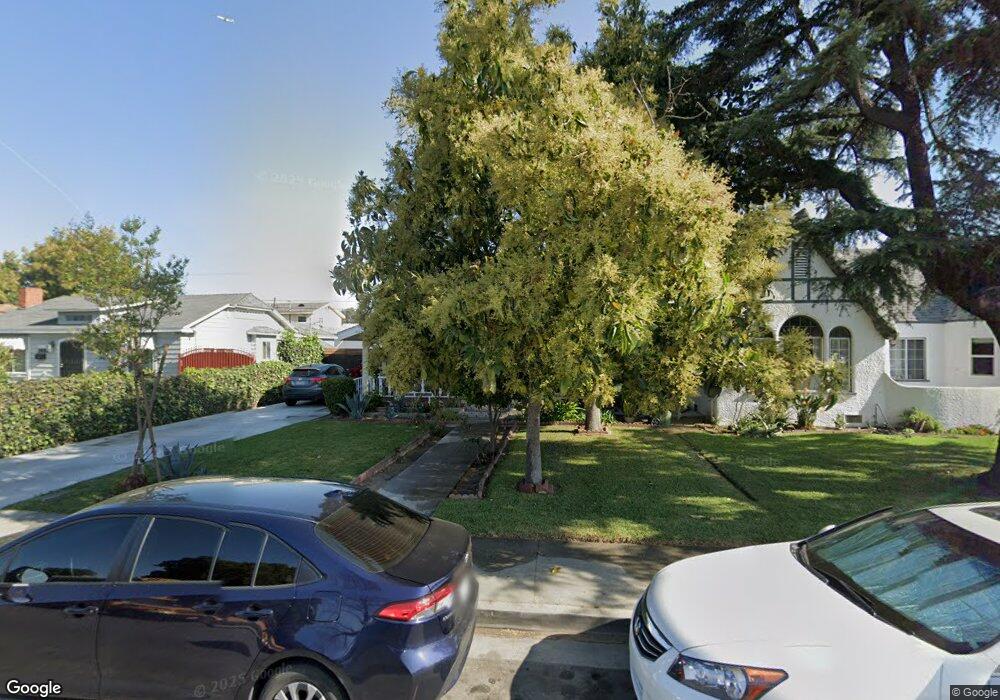
2661 Olive St Huntington Park, CA 90255
Walnut Park NeighborhoodEstimated Value: $597,000 - $668,000
2
Beds
1
Bath
1,194
Sq Ft
$537/Sq Ft
Est. Value
About This Home
This home is located at 2661 Olive St, Huntington Park, CA 90255 and is currently estimated at $641,501, approximately $537 per square foot. 2661 Olive St is a home located in Los Angeles County with nearby schools including Walnut Park Elementary School, Walnut Park Middle School, and Linda Esperanza Marquez High School.
Ownership History
Date
Name
Owned For
Owner Type
Purchase Details
Closed on
May 20, 2021
Sold by
Correa Rene G
Bought by
Correa Rene G and Correa Cesar O
Current Estimated Value
Purchase Details
Closed on
Dec 22, 2015
Sold by
Aguayo William
Bought by
Correa Rene G
Home Financials for this Owner
Home Financials are based on the most recent Mortgage that was taken out on this home.
Original Mortgage
$272,000
Interest Rate
3.97%
Mortgage Type
New Conventional
Purchase Details
Closed on
Sep 27, 2012
Sold by
Aguayo Rowland Rose Mary
Bought by
Rowland Mark and Aguayo Rowland Rose Mary
Purchase Details
Closed on
Sep 29, 2009
Sold by
Aguayo Joseph
Bought by
Aguayo Joseph
Purchase Details
Closed on
Sep 28, 2009
Sold by
Aguayo William
Bought by
Aguayo William
Purchase Details
Closed on
Sep 18, 2009
Sold by
Aguayo William and The Aguayo Family Trust 2006
Bought by
Rowland Rose Mary
Purchase Details
Closed on
Apr 19, 2006
Sold by
Aguayo Lautaro and Aguayo Ana Margarita
Bought by
Aguayo Lautaro
Create a Home Valuation Report for This Property
The Home Valuation Report is an in-depth analysis detailing your home's value as well as a comparison with similar homes in the area
Home Values in the Area
Average Home Value in this Area
Purchase History
| Date | Buyer | Sale Price | Title Company |
|---|---|---|---|
| Correa Rene G | -- | Orange Coast Title | |
| Correa Rene G | $340,000 | Chicago Title Company | |
| Rowland Mark | -- | None Available | |
| Aguayo Joseph | -- | None Available | |
| Aguayo William | -- | None Available | |
| Rowland Rose Mary | -- | None Available | |
| Aguayo Lautaro | -- | None Available |
Source: Public Records
Mortgage History
| Date | Status | Borrower | Loan Amount |
|---|---|---|---|
| Previous Owner | Correa Rene G | $272,000 |
Source: Public Records
Tax History Compared to Growth
Tax History
| Year | Tax Paid | Tax Assessment Tax Assessment Total Assessment is a certain percentage of the fair market value that is determined by local assessors to be the total taxable value of land and additions on the property. | Land | Improvement |
|---|---|---|---|---|
| 2025 | $5,614 | $402,484 | $303,405 | $99,079 |
| 2024 | $5,614 | $394,593 | $297,456 | $97,137 |
| 2023 | $5,436 | $386,857 | $291,624 | $95,233 |
| 2022 | $5,145 | $379,272 | $285,906 | $93,366 |
| 2021 | $5,032 | $371,836 | $280,300 | $91,536 |
| 2020 | $5,067 | $368,024 | $277,426 | $90,598 |
| 2019 | $4,878 | $360,809 | $271,987 | $88,822 |
| 2018 | $4,759 | $353,735 | $266,654 | $87,081 |
| 2016 | $1,079 | $43,229 | $22,755 | $20,474 |
| 2015 | $1,065 | $42,581 | $22,414 | $20,167 |
| 2014 | $1,069 | $41,747 | $21,975 | $19,772 |
Source: Public Records
Map
Nearby Homes
- 2742 Olive St
- 4 beds/ 3.5 baths Plan at Alma Homes
- 3 bed/ 2.5 baths Plan at Alma Homes
- 2712 California St
- 2749 Live Oak St
- 2806 Cudahy St
- 2526 Flower St
- 2912 Hill St
- 7223 Seville Ave
- 2829 California St
- 2434 Broadway
- 2930 Live Oak St
- 2565 Sale Place
- 2467 California St
- 3007 Flower St
- 7126 Stafford Ave
- 2555 Cass Place
- 2439 California St
- 3037 Cudahy St
- 2485 Cass Place