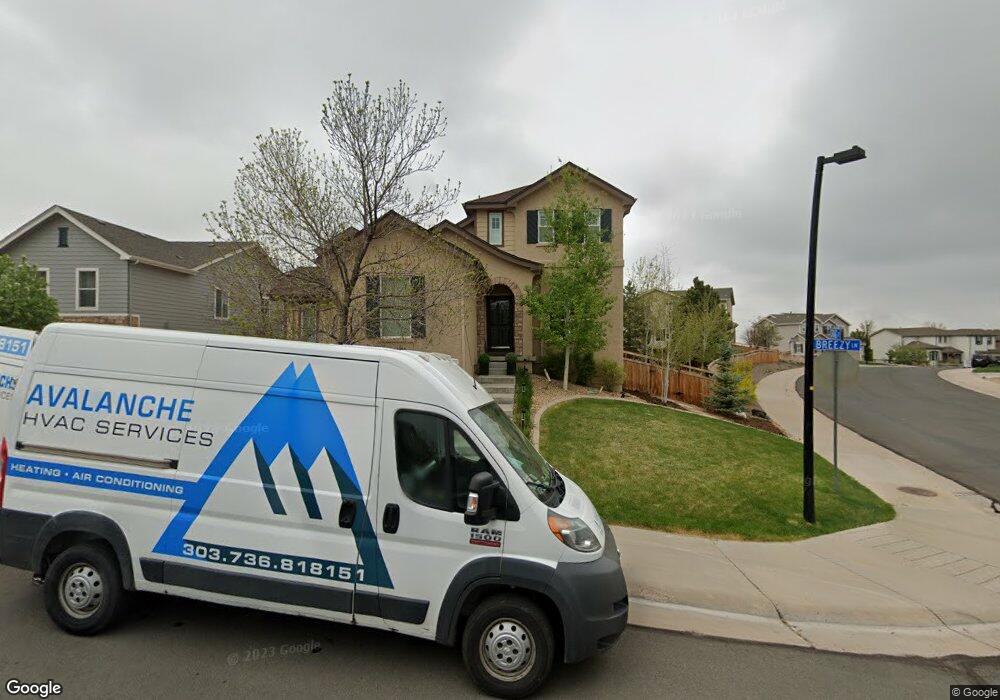
2662 Breezy Ln Castle Rock, CO 80109
The Meadows NeighborhoodEstimated Value: $759,000 - $797,000
4
Beds
4
Baths
3,085
Sq Ft
$254/Sq Ft
Est. Value
About This Home
This home is located at 2662 Breezy Ln, Castle Rock, CO 80109 and is currently estimated at $782,539, approximately $253 per square foot. 2662 Breezy Ln is a home located in Douglas County with nearby schools including Soaring Hawk Elementary School, Castle Rock Middle School, and Castle View High School.
Ownership History
Date
Name
Owned For
Owner Type
Purchase Details
Closed on
Aug 5, 2025
Sold by
Robert G Mason And Danielle W Mason Trus
Bought by
Mason Robert G and Mason Danielle W
Current Estimated Value
Home Financials for this Owner
Home Financials are based on the most recent Mortgage that was taken out on this home.
Original Mortgage
$250,000
Outstanding Balance
$249,680
Interest Rate
6.72%
Mortgage Type
Credit Line Revolving
Estimated Equity
$532,859
Purchase Details
Closed on
Jul 25, 2025
Sold by
Mason Robert G and Mason Danielle W
Bought by
Robert G Mason And Danielle W Mason Trust
Home Financials for this Owner
Home Financials are based on the most recent Mortgage that was taken out on this home.
Original Mortgage
$250,000
Outstanding Balance
$249,680
Interest Rate
6.72%
Mortgage Type
Credit Line Revolving
Estimated Equity
$532,859
Purchase Details
Closed on
Apr 23, 2025
Sold by
Mason Robert G and Mason Danielle W
Bought by
Robert G Mason And Danielle W Mason Trust
Purchase Details
Closed on
Feb 24, 2020
Sold by
Freear Tyler M and Freear Jill R
Bought by
Mason Robert G and Mason Danielle W
Home Financials for this Owner
Home Financials are based on the most recent Mortgage that was taken out on this home.
Original Mortgage
$200,000
Interest Rate
3.6%
Mortgage Type
New Conventional
Purchase Details
Closed on
Apr 25, 2014
Sold by
Forsberg Chris
Bought by
Freear Tyler M and Freear Jill R
Home Financials for this Owner
Home Financials are based on the most recent Mortgage that was taken out on this home.
Original Mortgage
$397,842
Interest Rate
4.25%
Mortgage Type
FHA
Purchase Details
Closed on
Nov 30, 2011
Sold by
Fannie Mae
Bought by
Forsberg Chris
Home Financials for this Owner
Home Financials are based on the most recent Mortgage that was taken out on this home.
Original Mortgage
$337,487
Interest Rate
4.13%
Mortgage Type
VA
Purchase Details
Closed on
Jun 24, 2011
Sold by
Gilmartin Suzanne M and Gilmartin Matthew
Bought by
Federal National Mortgage Association
Purchase Details
Closed on
Aug 10, 2007
Sold by
Joyce Homes Inc
Bought by
Gilmartin Suzanne M and Gilmartin Matthew C
Home Financials for this Owner
Home Financials are based on the most recent Mortgage that was taken out on this home.
Original Mortgage
$378,400
Interest Rate
6.69%
Mortgage Type
New Conventional
Purchase Details
Closed on
Dec 30, 2003
Sold by
Castle Rock Development Company
Bought by
Joyce Homes Inc
Purchase Details
Closed on
Jan 2, 2003
Sold by
Castle Rock Land Co Llc
Bought by
Castle Rock Development Company
Create a Home Valuation Report for This Property
The Home Valuation Report is an in-depth analysis detailing your home's value as well as a comparison with similar homes in the area
Home Values in the Area
Average Home Value in this Area
Purchase History
| Date | Buyer | Sale Price | Title Company |
|---|---|---|---|
| Mason Robert G | -- | Land Title | |
| Robert G Mason And Danielle W Mason Trust | -- | Land Title Guarantee Company | |
| Robert G Mason And Danielle W Mason Trust | -- | None Listed On Document | |
| Mason Robert G | $550,000 | Land Title Guarantee Co | |
| Freear Tyler M | $406,500 | Land Title Guarantee Company | |
| Forsberg Chris | $350,000 | Cat | |
| Federal National Mortgage Association | -- | None Available | |
| Gilmartin Suzanne M | $473,117 | Land Title Guarantee Company | |
| Joyce Homes Inc | $938,500 | -- | |
| Castle Rock Development Company | $5,729,000 | -- |
Source: Public Records
Mortgage History
| Date | Status | Borrower | Loan Amount |
|---|---|---|---|
| Open | Mason Robert G | $250,000 | |
| Previous Owner | Mason Robert G | $200,000 | |
| Previous Owner | Freear Tyler M | $397,842 | |
| Previous Owner | Forsberg Chris | $337,487 | |
| Previous Owner | Gilmartin Suzanne M | $378,400 |
Source: Public Records
Tax History Compared to Growth
Tax History
| Year | Tax Paid | Tax Assessment Tax Assessment Total Assessment is a certain percentage of the fair market value that is determined by local assessors to be the total taxable value of land and additions on the property. | Land | Improvement |
|---|---|---|---|---|
| 2024 | $5,247 | $54,010 | $12,950 | $41,060 |
| 2023 | $5,296 | $54,010 | $12,950 | $41,060 |
| 2022 | $3,848 | $37,860 | $8,980 | $28,880 |
| 2021 | $3,996 | $37,860 | $8,980 | $28,880 |
| 2020 | $3,788 | $36,740 | $8,350 | $28,390 |
| 2019 | $3,801 | $36,740 | $8,350 | $28,390 |
| 2018 | $3,626 | $34,460 | $6,350 | $28,110 |
| 2017 | $3,421 | $34,460 | $6,350 | $28,110 |
| 2016 | $3,238 | $32,060 | $5,990 | $26,070 |
| 2015 | $3,298 | $32,060 | $5,990 | $26,070 |
| 2014 | $3,039 | $27,890 | $5,570 | $22,320 |
Source: Public Records
Map
Nearby Homes
- 2877 Craig Ct
- 2880 Breezy Ln
- 2868 Breezy Ln
- 3016 Breezy Ln
- 2980 Craig Ct
- 3066 Craig Ct
- 3048 Starling Ct
- 5238 Gould Cir
- 3266 Coyote Hills Way
- 2310 Woodhouse Ln
- 2872 Feather Ct
- 2934 Feather Ct
- 4351 Applecrest Cir
- 3443 Elk Run Dr
- 3348 Elk Run Dr
- 4245 Prairie Rose Cir
- 3438 Elk Run Dr
- 4433 Prairie Rose Cir
- 2081 Gypsy Moth Ct
- 3389 Willowrun Dr
- 2676 Breezy Ln
- 2860 Paw Print Way
- 2798 Paw Print Way
- 2688 Breezy Ln
- 2820 Craig Ct
- 2756 Paw Print Way
- 2722 Paw Print Way
- 2669 Breezy Ln
- 2842 Craig Ct
- 2655 Breezy Ln
- 2702 Breezy Ln
- 2683 Breezy Ln
- 2643 Breezy Ln
- 2698 Paw Print Way
- 2634 Breezy Ln
- 2695 Breezy Ln
- 2716 Breezy Ln
- 2866 Craig Ct
- 2629 Breezy Ln
- 2865 Craig Ct