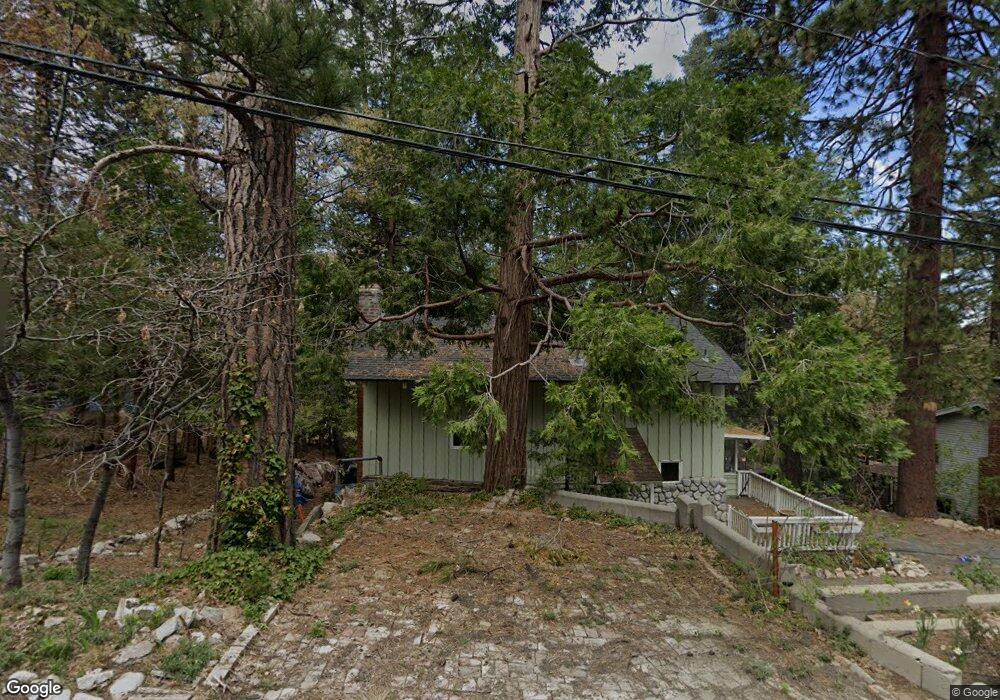
2662 East Dr Running Springs, CA 92382
Estimated Value: $346,162 - $411,000
3
Beds
2
Baths
1,408
Sq Ft
$267/Sq Ft
Est. Value
About This Home
This home is located at 2662 East Dr, Running Springs, CA 92382 and is currently estimated at $376,291, approximately $267 per square foot. 2662 East Dr is a home located in San Bernardino County with nearby schools including Charles Hoffman Elementary School, Mary P. Henck Intermediate School, and Rim Of The World Senior High School.
Ownership History
Date
Name
Owned For
Owner Type
Purchase Details
Closed on
Mar 30, 2011
Sold by
Root Teri
Bought by
Henry Ronald W and Henry Elizabeth M
Current Estimated Value
Purchase Details
Closed on
Nov 3, 2000
Sold by
Radcliffe William M and Radcliffe Mari Lee
Bought by
Root Teri
Home Financials for this Owner
Home Financials are based on the most recent Mortgage that was taken out on this home.
Original Mortgage
$103,500
Interest Rate
7.67%
Purchase Details
Closed on
Jul 16, 1997
Sold by
New Elmer E & Lorraine M Family Trust and New Lorraine M Tr
Bought by
Radcliffe William M and Radcliffe Mari Lee
Home Financials for this Owner
Home Financials are based on the most recent Mortgage that was taken out on this home.
Original Mortgage
$67,450
Interest Rate
7.45%
Create a Home Valuation Report for This Property
The Home Valuation Report is an in-depth analysis detailing your home's value as well as a comparison with similar homes in the area
Home Values in the Area
Average Home Value in this Area
Purchase History
| Date | Buyer | Sale Price | Title Company |
|---|---|---|---|
| Henry Ronald W | $99,000 | Stewart Title | |
| Root Teri | $115,000 | Orange Coast Title | |
| Radcliffe William M | $75,500 | First American Title Ins Co |
Source: Public Records
Mortgage History
| Date | Status | Borrower | Loan Amount |
|---|---|---|---|
| Previous Owner | Root Teri | $103,500 | |
| Previous Owner | Radcliffe William M | $67,450 |
Source: Public Records
Tax History Compared to Growth
Tax History
| Year | Tax Paid | Tax Assessment Tax Assessment Total Assessment is a certain percentage of the fair market value that is determined by local assessors to be the total taxable value of land and additions on the property. | Land | Improvement |
|---|---|---|---|---|
| 2025 | $1,747 | $126,836 | $15,220 | $111,616 |
| 2024 | $1,747 | $124,349 | $14,922 | $109,427 |
| 2023 | $1,729 | $121,910 | $14,629 | $107,281 |
| 2022 | $1,699 | $119,519 | $14,342 | $105,177 |
| 2021 | $1,682 | $117,176 | $14,061 | $103,115 |
| 2020 | $1,682 | $115,975 | $13,917 | $102,058 |
| 2019 | $1,645 | $113,701 | $13,644 | $100,057 |
| 2018 | $1,563 | $111,471 | $13,376 | $98,095 |
| 2017 | $1,538 | $109,286 | $13,114 | $96,172 |
| 2016 | $1,497 | $107,143 | $12,857 | $94,286 |
| 2015 | $1,483 | $105,534 | $12,664 | $92,870 |
| 2014 | $1,461 | $103,467 | $12,416 | $91,051 |
Source: Public Records
Map
Nearby Homes
- 32220 Mohan Way
- 32311 Fern Dr
- 32296 Fern Dr
- 2686 Viking Ln
- 0 Cobblestone Ln Unit IG24253088
- 32159 Cove Cir
- 32455 Scandia Dr
- 32065 Hunsaker Way Unit 12
- 32490 Scandia Dr
- 32079 Fern Dr
- 32068 Hunsaker Way
- 32538 Scandia Dr
- 25 Pine Cone Dr
- 2442 Hunsaker Dr
- 2493 Palo Alto Way
- 31967 Pine Cone Dr
- 2564 Spring Dr
- 31954 Pine Cone Dr
- 2395 Hunsaker Dr
- 2524 Spring Dr