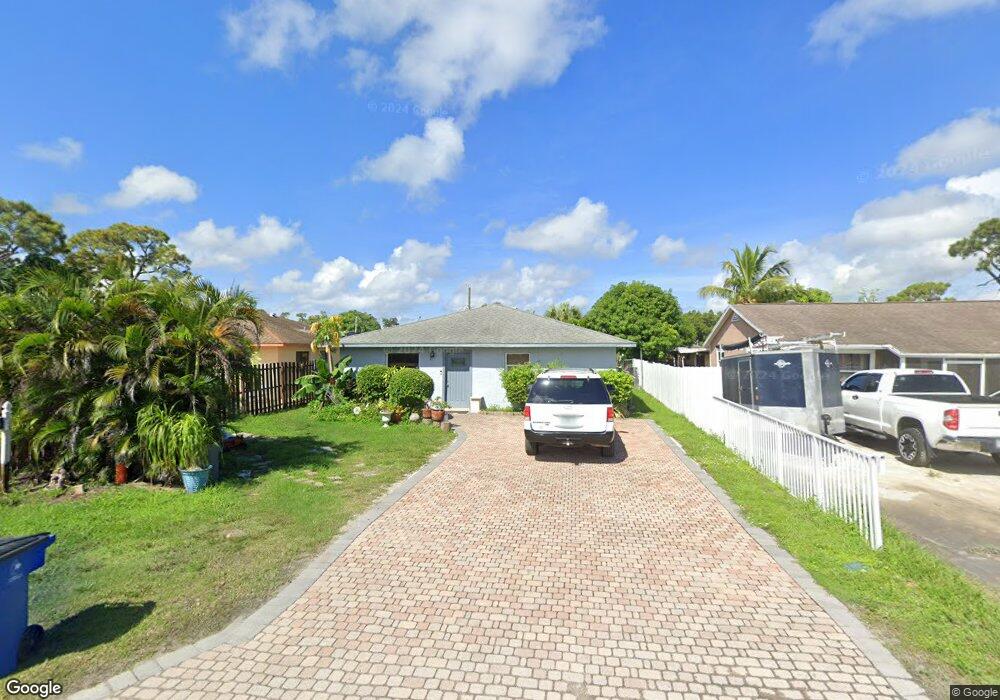
26630 Nottingham Ln Bonita Springs, FL 34135
Downtown Bonita Springs NeighborhoodEstimated Value: $255,000 - $324,000
3
Beds
2
Baths
1,360
Sq Ft
$209/Sq Ft
Est. Value
About This Home
This home is located at 26630 Nottingham Ln, Bonita Springs, FL 34135 and is currently estimated at $284,657, approximately $209 per square foot. 26630 Nottingham Ln is a home located in Lee County with nearby schools including Bonita Springs Elementary School, Spring Creek Elementary School, and Pinewoods Elementary School.
Ownership History
Date
Name
Owned For
Owner Type
Purchase Details
Closed on
Jan 3, 2014
Sold by
Gonzalez Gaston P
Bought by
Mejia Cornelio E and Lopez Magdalena Alcon
Current Estimated Value
Purchase Details
Closed on
Mar 22, 2013
Sold by
Federal Home Loan Mortgage Corporation
Bought by
Gonzales Gaston P
Purchase Details
Closed on
Mar 5, 2013
Sold by
Citimortgage Inc
Bought by
Federal Home Loan Mortgage Corporation
Purchase Details
Closed on
Feb 11, 2013
Sold by
Ciardi Dietz Paula and Moore Paula
Bought by
Citimortgage Inc
Purchase Details
Closed on
Sep 8, 2008
Sold by
Ciardi Dietz Paula
Bought by
Ciardi Dietz Paula and Dietz Daniel A
Purchase Details
Closed on
Aug 16, 1993
Sold by
Stewart Rebecca E
Bought by
Moore John and Moore Paula
Home Financials for this Owner
Home Financials are based on the most recent Mortgage that was taken out on this home.
Original Mortgage
$50,985
Interest Rate
7.22%
Mortgage Type
FHA
Create a Home Valuation Report for This Property
The Home Valuation Report is an in-depth analysis detailing your home's value as well as a comparison with similar homes in the area
Home Values in the Area
Average Home Value in this Area
Purchase History
| Date | Buyer | Sale Price | Title Company |
|---|---|---|---|
| Mejia Cornelio E | $95,000 | Classic Title Services Inc | |
| Gonzales Gaston P | $64,900 | Buyers Title Inc | |
| Federal Home Loan Mortgage Corporation | -- | Buyers Title Inc | |
| Citimortgage Inc | $112,400 | None Available | |
| Ciardi Dietz Paula | -- | None Available | |
| Moore John | $50,000 | -- |
Source: Public Records
Mortgage History
| Date | Status | Borrower | Loan Amount |
|---|---|---|---|
| Previous Owner | Moore John | $50,985 |
Source: Public Records
Tax History Compared to Growth
Tax History
| Year | Tax Paid | Tax Assessment Tax Assessment Total Assessment is a certain percentage of the fair market value that is determined by local assessors to be the total taxable value of land and additions on the property. | Land | Improvement |
|---|---|---|---|---|
| 2025 | $2,639 | $171,666 | -- | -- |
| 2024 | $2,963 | $156,060 | -- | -- |
| 2023 | $2,963 | $141,873 | $0 | $0 |
| 2022 | $2,538 | $128,975 | $0 | $0 |
| 2021 | $1,991 | $132,743 | $11,842 | $120,901 |
| 2020 | $1,792 | $106,591 | $8,500 | $98,091 |
| 2019 | $1,790 | $107,399 | $8,000 | $99,399 |
| 2018 | $1,675 | $104,170 | $8,000 | $96,170 |
| 2017 | $1,567 | $93,672 | $8,000 | $85,672 |
| 2016 | $1,416 | $79,090 | $9,528 | $69,562 |
| 2015 | $1,507 | $83,201 | $9,507 | $73,694 |
| 2014 | -- | $63,302 | $12,093 | $51,209 |
| 2013 | -- | $55,675 | $10,888 | $44,787 |
Source: Public Records
Map
Nearby Homes
- 26650 Coventry Ln
- 10632 Woods Cir Unit 1
- 10230 Cobble Hill Rd
- 11051 Wagon Trail
- 11068 New Moon Ct
- 10240 Cobble Notch Loop Unit 201
- 10240 Cobble Notch Loop Unit 202
- 27075 Orange Court Dr
- 26502 Lucky Stone Rd Unit 101
- 26985 Croise Dr
- 26979 Croise Dr
- 26490 Lucky Stone Rd Unit 102
- 11273 Coimbra Ln
- 11264 Coimbra Ln
- 26459 Doverstone St
- 11153 San Sebastian Ln
- 26791 N Riverside Dr
- 26485 Lucky Stone Rd Unit 202
- 26610 Nottingham Ln
- 26650 Nottingham Ln
- 26590 Nottingham Ln
- 26631/633 Noble Ln
- 26651/653 Noble Ln
- 26611 Noble Ln
- 26690 Nottingham Ln
- 26591 Noble Ln
- 26671/673 Noble Ln
- 26550/552 Nottingham Ln
- 26611 Nottingham Ln
- 26651 Nottingham Ln
- 26710 Nottingham Ln
- 26571 Noble Ln
- 26591 Nottingham Ln
- 26691/693 Noble Ln
- 26573 Nottingham Ln
- 26530 Nottingham Ln
- 26551 Noble Ln
- 26571 Nottingham Ln