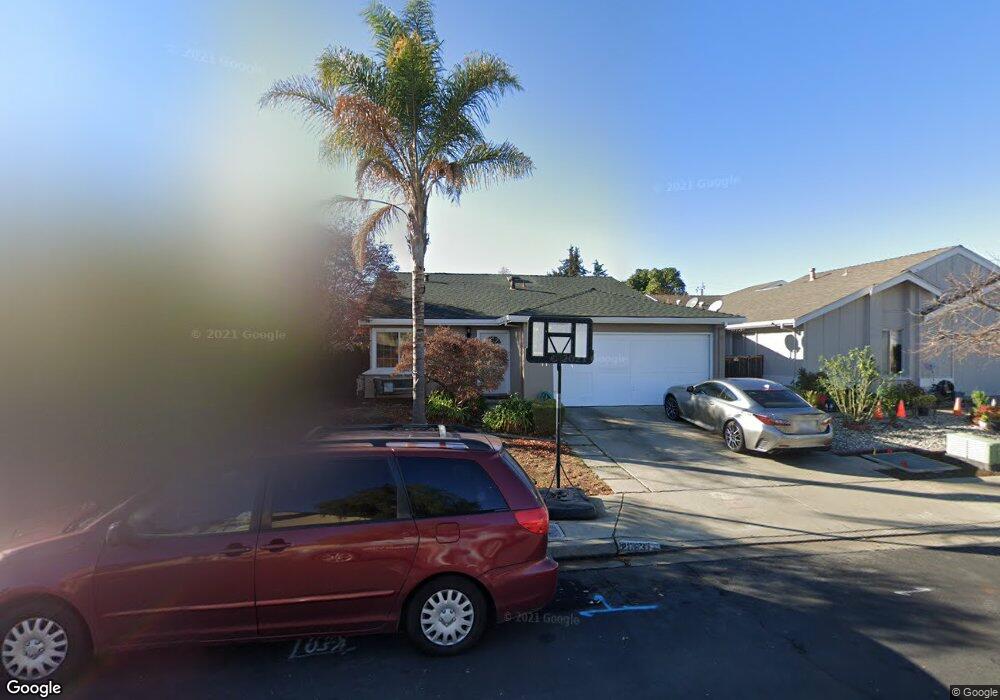
26637 Joshua St Hayward, CA 94544
Whitman-Wocine NeighborhoodEstimated Value: $786,000 - $937,000
3
Beds
2
Baths
1,296
Sq Ft
$645/Sq Ft
Est. Value
About This Home
This home is located at 26637 Joshua St, Hayward, CA 94544 and is currently estimated at $836,059, approximately $645 per square foot. 26637 Joshua St is a home located in Alameda County with nearby schools including Tyrrell Elementary School, Cesar Chavez Middle School, and Tennyson High School.
Ownership History
Date
Name
Owned For
Owner Type
Purchase Details
Closed on
Nov 26, 2001
Sold by
Romero Jose S and Romero Blanca E
Bought by
Limon Francisco A
Current Estimated Value
Home Financials for this Owner
Home Financials are based on the most recent Mortgage that was taken out on this home.
Original Mortgage
$248,000
Outstanding Balance
$105,353
Interest Rate
7.75%
Estimated Equity
$730,706
Purchase Details
Closed on
Feb 1, 2001
Sold by
Romero Jose S
Bought by
Romero Jose S
Create a Home Valuation Report for This Property
The Home Valuation Report is an in-depth analysis detailing your home's value as well as a comparison with similar homes in the area
Home Values in the Area
Average Home Value in this Area
Purchase History
| Date | Buyer | Sale Price | Title Company |
|---|---|---|---|
| Limon Francisco A | $310,000 | -- | |
| Romero Jose S | -- | -- |
Source: Public Records
Mortgage History
| Date | Status | Borrower | Loan Amount |
|---|---|---|---|
| Open | Limon Francisco A | $248,000 | |
| Closed | Limon Francisco A | $62,000 |
Source: Public Records
Tax History Compared to Growth
Tax History
| Year | Tax Paid | Tax Assessment Tax Assessment Total Assessment is a certain percentage of the fair market value that is determined by local assessors to be the total taxable value of land and additions on the property. | Land | Improvement |
|---|---|---|---|---|
| 2025 | $5,694 | $457,931 | $137,379 | $320,552 |
| 2024 | $5,694 | $448,954 | $134,686 | $314,268 |
| 2023 | $5,611 | $440,153 | $132,046 | $308,107 |
| 2022 | $6,083 | $431,522 | $129,456 | $302,066 |
| 2021 | $6,037 | $423,062 | $126,918 | $296,144 |
| 2020 | $5,961 | $418,725 | $125,617 | $293,108 |
| 2019 | $5,972 | $410,517 | $123,155 | $287,362 |
| 2018 | $5,112 | $402,468 | $120,740 | $281,728 |
| 2017 | $5,527 | $394,580 | $118,374 | $276,206 |
| 2016 | $5,512 | $386,845 | $116,053 | $270,792 |
| 2015 | $5,357 | $381,035 | $114,310 | $266,725 |
| 2014 | $5,114 | $373,574 | $112,072 | $261,502 |
Source: Public Records
Map
Nearby Homes
- 250 Jacaranda Dr
- 266 Gloria St
- 26132 Jane Ave
- 250 Schafer Rd
- 26632 Luvena Dr
- 399 Schafer Rd
- 26361 Huntwood Ave
- 26583 Greta Ln
- 26517 Sunvale Ct Unit 3
- 25943 Dollar St
- 27418 Susan Place Unit 3
- Plan 5-Alt at Fusion - Live-Work Homes
- Plan 5 at Fusion - Live-Work Homes
- Plan 1 at Fusion - Townhomes
- Plan 2 at Fusion - Townhomes
- Plan 6 at Fusion - Live-Work Homes
- Plan 3 at Fusion - Townhomes
- Plan 4 at Fusion - Townhomes
- 25696 Lander Ave
- 318 Dumont Ave
- 26629 Joshua St
- 26645 Joshua St
- 26621 Joshua St
- 26634 Jane Ave
- 204 Steel St
- 26626 Jane Ave
- 26653 Joshua St
- 26613 Joshua St
- 26634 Joshua St
- 26642 Joshua St
- 26650 Joshua St
- 26605 Joshua St
- 236 Ebony Way
- 26661 Joshua St
- 26662 Joshua St
- 240 Ebony Way
- 239 Ebony Way
- 26597 Joshua St
- 26610 Jane Ave
- 194 Stanislaus Way