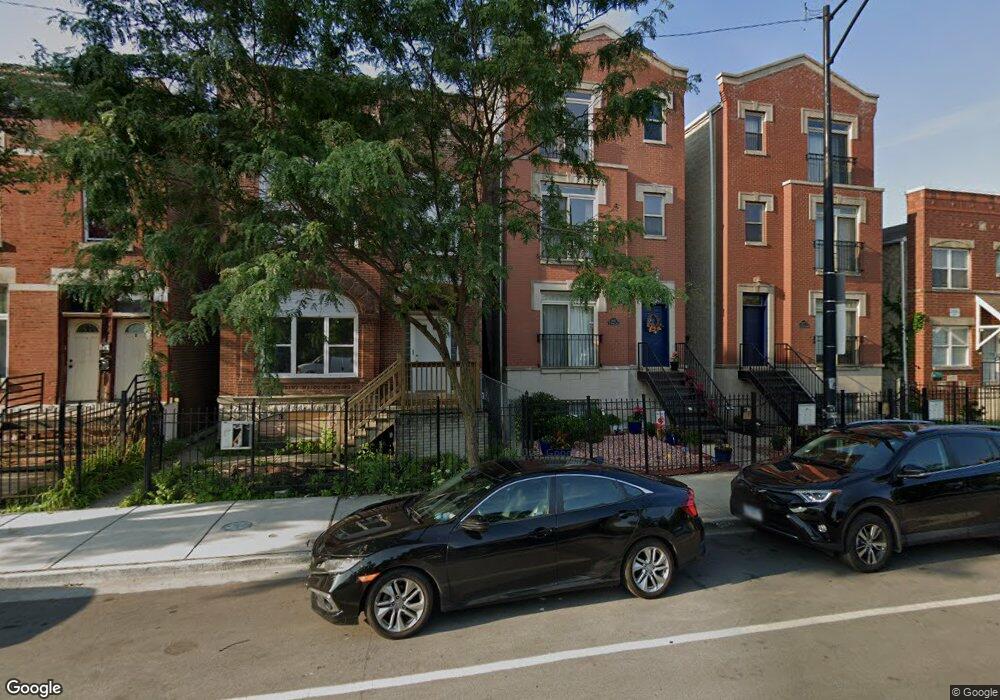
2665 W Warren Blvd Unit 1 Chicago, IL 60612
Garfield Park NeighborhoodEstimated Value: $274,000 - $394,000
4
Beds
3
Baths
2,250
Sq Ft
$148/Sq Ft
Est. Value
About This Home
This home is located at 2665 W Warren Blvd Unit 1, Chicago, IL 60612 and is currently estimated at $334,042, approximately $148 per square foot. 2665 W Warren Blvd Unit 1 is a home located in Cook County with nearby schools including Cather Elementary School, Marshall Metropolitan High School, and LEARN Charles and Dorothy Campbell Campus.
Ownership History
Date
Name
Owned For
Owner Type
Purchase Details
Closed on
Aug 30, 2013
Sold by
Gonzalez Carmen and Romero Miguel A
Bought by
Gonzalez Carmen
Current Estimated Value
Purchase Details
Closed on
Sep 26, 2005
Sold by
Butler Errol S and Butler Heather M
Bought by
Gonzalez Carmen and Romero Miguel A
Home Financials for this Owner
Home Financials are based on the most recent Mortgage that was taken out on this home.
Original Mortgage
$248,000
Outstanding Balance
$133,827
Interest Rate
5.89%
Mortgage Type
Fannie Mae Freddie Mac
Estimated Equity
$200,215
Purchase Details
Closed on
May 31, 2002
Sold by
Prairie Bank & Trust Company
Bought by
Butler Errol S and Butler Heather M
Home Financials for this Owner
Home Financials are based on the most recent Mortgage that was taken out on this home.
Original Mortgage
$214,605
Interest Rate
6.87%
Create a Home Valuation Report for This Property
The Home Valuation Report is an in-depth analysis detailing your home's value as well as a comparison with similar homes in the area
Home Values in the Area
Average Home Value in this Area
Purchase History
| Date | Buyer | Sale Price | Title Company |
|---|---|---|---|
| Gonzalez Carmen | -- | None Available | |
| Gonzalez Carmen | $310,000 | First American Title | |
| Butler Errol S | $226,000 | -- |
Source: Public Records
Mortgage History
| Date | Status | Borrower | Loan Amount |
|---|---|---|---|
| Open | Gonzalez Carmen | $248,000 | |
| Previous Owner | Butler Errol S | $214,605 |
Source: Public Records
Tax History Compared to Growth
Tax History
| Year | Tax Paid | Tax Assessment Tax Assessment Total Assessment is a certain percentage of the fair market value that is determined by local assessors to be the total taxable value of land and additions on the property. | Land | Improvement |
|---|---|---|---|---|
| 2024 | $4,575 | $44,697 | $3,835 | $40,862 |
| 2023 | $4,438 | $25,001 | $3,098 | $21,903 |
| 2022 | $4,438 | $25,001 | $3,098 | $21,903 |
| 2021 | $4,357 | $24,999 | $3,097 | $21,902 |
| 2020 | $4,444 | $23,051 | $3,097 | $19,954 |
| 2019 | $4,466 | $25,656 | $3,097 | $22,559 |
| 2018 | $4,389 | $25,656 | $3,097 | $22,559 |
| 2017 | $2,849 | $16,610 | $2,728 | $13,882 |
| 2016 | $2,827 | $16,610 | $2,728 | $13,882 |
| 2015 | $2,563 | $16,610 | $2,728 | $13,882 |
| 2014 | $3,031 | $18,903 | $2,655 | $16,248 |
| 2013 | $2,960 | $18,903 | $2,655 | $16,248 |
Source: Public Records
Map
Nearby Homes
- 2665 W Warren Blvd Unit 3
- 2723 W Washington Blvd
- 2718 W Washington Blvd
- 2663 W Maypole Ave
- 2553 W Washington Blvd
- 2661 W Lake St
- 2663 W Lake St
- 2655 W Lake St
- 2705 W Lake St
- 2631 W Lake St
- 2625 W Lake St
- 2811 W Washington Blvd Unit 301
- 2735 W Lake St
- 2745 W Lake St
- 2526 W Monroe St
- 2537 W Monroe St Unit B
- 2638 W Adams St
- 2604 W Washington Blvd
- 2653 W Adams St
- 624 N Troy St
- 2667 W Warren Blvd Unit 26673
- 2667 W Warren Blvd Unit 26672
- 2665 W Warren Blvd Unit 26651
- 2665 W Warren Blvd Unit 26653
- 2667 W Warren Blvd Unit 26671
- 2665 W Warren Blvd Unit 26652
- 2665 W Warren Blvd
- 2665 W Warren Blvd Unit 2
- 2667 W Warren Blvd Unit 2
- 2667 W Warren Blvd Unit 1
- 2663 W Warren Blvd Unit 1
- 2663 W Warren Blvd
- 2661 W Warren Blvd
- 2661 W Warren Blvd
- 2657 W Warren Blvd
- 2657 W Warren Blvd Unit 2
- 2655 W Warren Blvd
- 2653 W Warren Blvd
- 2653 W Warren Blvd