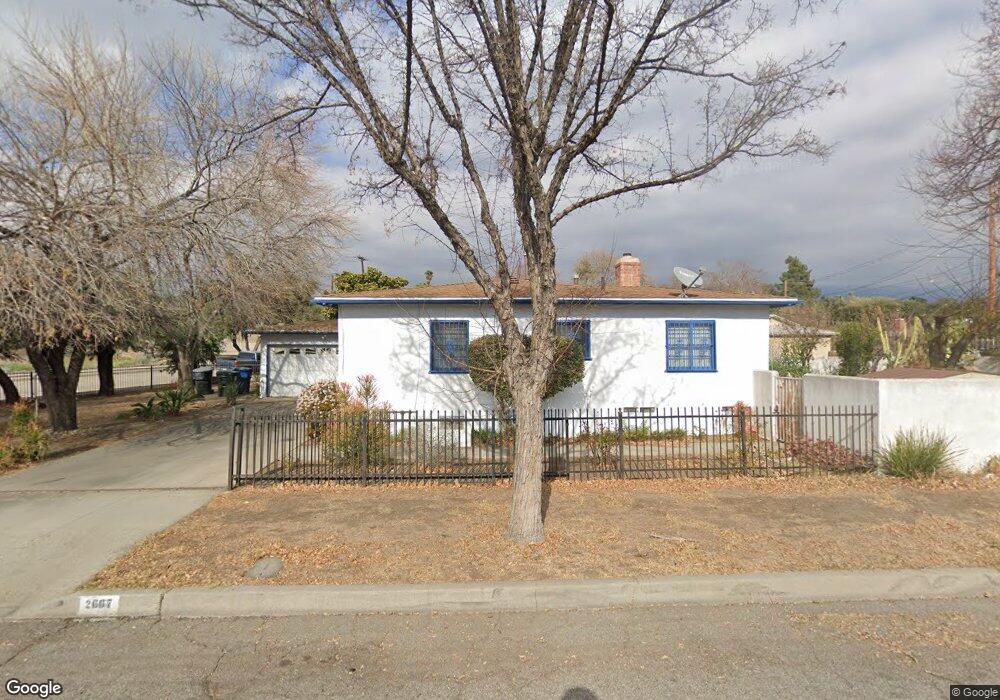
2667 Carlton St San Bernardino, CA 92405
Arrowview NeighborhoodEstimated Value: $368,000 - $449,621
2
Beds
1
Bath
1,106
Sq Ft
$379/Sq Ft
Est. Value
About This Home
This home is located at 2667 Carlton St, San Bernardino, CA 92405 and is currently estimated at $419,655, approximately $379 per square foot. 2667 Carlton St is a home located in San Bernardino County with nearby schools including George Brown Jr. Elementary, Arrowview Middle School, and San Bernardino High School.
Ownership History
Date
Name
Owned For
Owner Type
Purchase Details
Closed on
Dec 10, 2013
Sold by
Ochoa Thomas Caro
Bought by
Ochoa Thomas Caro
Current Estimated Value
Home Financials for this Owner
Home Financials are based on the most recent Mortgage that was taken out on this home.
Original Mortgage
$100,450
Outstanding Balance
$75,404
Interest Rate
4.32%
Mortgage Type
New Conventional
Estimated Equity
$344,251
Purchase Details
Closed on
Oct 1, 2013
Sold by
Leyva Jose Noe
Bought by
Ochoa Thomas Caro and Ochoa Yolanda L
Purchase Details
Closed on
Mar 11, 1999
Sold by
Petrie Neil J
Bought by
Leyva Jose Noe
Home Financials for this Owner
Home Financials are based on the most recent Mortgage that was taken out on this home.
Original Mortgage
$89,362
Interest Rate
7.1%
Mortgage Type
FHA
Create a Home Valuation Report for This Property
The Home Valuation Report is an in-depth analysis detailing your home's value as well as a comparison with similar homes in the area
Home Values in the Area
Average Home Value in this Area
Purchase History
| Date | Buyer | Sale Price | Title Company |
|---|---|---|---|
| Ochoa Thomas Caro | -- | Fidelity National Title Co | |
| Ochoa Thomas Caro | -- | Fidelity National Title Co | |
| Ochoa Thomas Caro | $143,500 | Fidelity National Title Co | |
| Leyva Jose Noe | $89,500 | American Title |
Source: Public Records
Mortgage History
| Date | Status | Borrower | Loan Amount |
|---|---|---|---|
| Open | Ochoa Thomas Caro | $100,450 | |
| Closed | Ochoa Thomas Caro | $100,450 | |
| Previous Owner | Leyva Jose Noe | $89,362 |
Source: Public Records
Tax History Compared to Growth
Tax History
| Year | Tax Paid | Tax Assessment Tax Assessment Total Assessment is a certain percentage of the fair market value that is determined by local assessors to be the total taxable value of land and additions on the property. | Land | Improvement |
|---|---|---|---|---|
| 2025 | $2,235 | $175,911 | $52,775 | $123,136 |
| 2024 | $2,235 | $172,462 | $51,740 | $120,722 |
| 2023 | $2,178 | $169,080 | $50,725 | $118,355 |
| 2022 | $2,177 | $165,764 | $49,730 | $116,034 |
| 2021 | $2,177 | $162,514 | $48,755 | $113,759 |
| 2020 | $2,180 | $160,848 | $48,255 | $112,593 |
| 2019 | $2,116 | $157,694 | $47,309 | $110,385 |
| 2018 | $2,091 | $154,602 | $46,381 | $108,221 |
| 2017 | $2,025 | $151,571 | $45,472 | $106,099 |
| 2016 | $1,962 | $148,599 | $44,580 | $104,019 |
| 2015 | $1,847 | $146,367 | $43,910 | $102,457 |
| 2014 | $1,885 | $143,500 | $43,050 | $100,450 |
Source: Public Records
Map
Nearby Homes