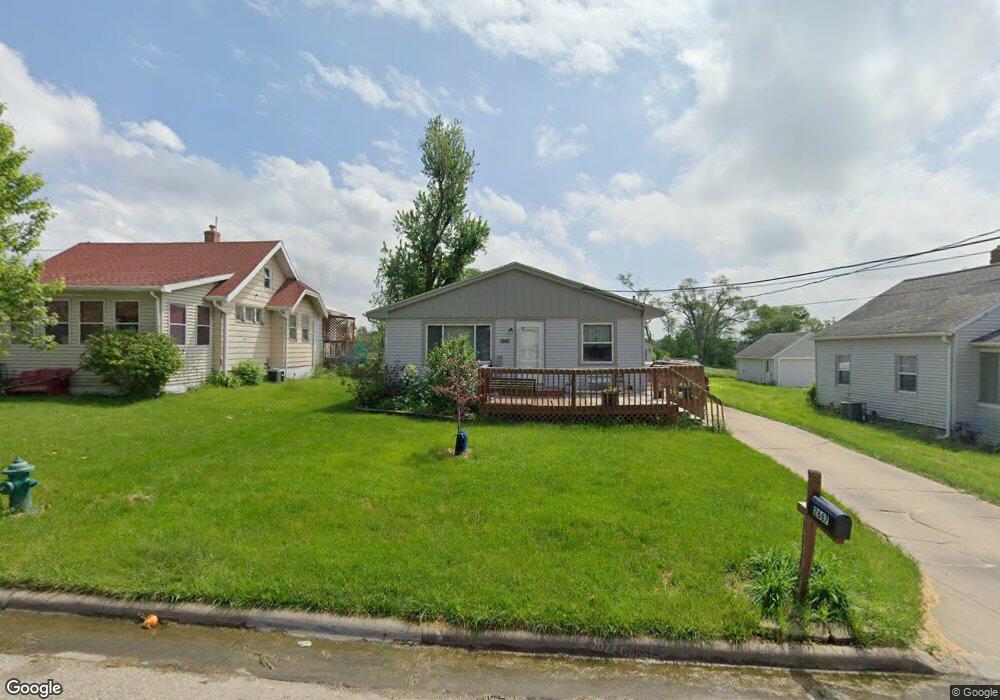
2667 Fruitland Blvd SW Cedar Rapids, IA 52404
Southwest Area NeighborhoodEstimated Value: $161,000 - $207,000
3
Beds
2
Baths
1,608
Sq Ft
$119/Sq Ft
Est. Value
About This Home
This home is located at 2667 Fruitland Blvd SW, Cedar Rapids, IA 52404 and is currently estimated at $190,891, approximately $118 per square foot. 2667 Fruitland Blvd SW is a home located in Linn County with nearby schools including Junction City Elementary School, Grant Elementary School, and Bruce Hall Day Treatment Center.
Ownership History
Date
Name
Owned For
Owner Type
Purchase Details
Closed on
Apr 21, 2009
Sold by
Gralund Todd W and Gralund Sheri L
Bought by
Flitsch Melvin L and Vollbrecht Caroline A
Current Estimated Value
Home Financials for this Owner
Home Financials are based on the most recent Mortgage that was taken out on this home.
Original Mortgage
$88,830
Outstanding Balance
$56,486
Interest Rate
5.05%
Mortgage Type
Purchase Money Mortgage
Estimated Equity
$134,405
Purchase Details
Closed on
Jun 8, 2006
Sold by
Gralund Todd W and Gralund Sheril
Bought by
Gralund Todd W and Gralund Sheri L
Home Financials for this Owner
Home Financials are based on the most recent Mortgage that was taken out on this home.
Original Mortgage
$115,710
Interest Rate
6.68%
Mortgage Type
FHA
Purchase Details
Closed on
May 25, 1999
Sold by
Eggert Jerome A and Eggert Kathy J
Bought by
Gralund Todd W
Home Financials for this Owner
Home Financials are based on the most recent Mortgage that was taken out on this home.
Original Mortgage
$82,957
Interest Rate
6.92%
Create a Home Valuation Report for This Property
The Home Valuation Report is an in-depth analysis detailing your home's value as well as a comparison with similar homes in the area
Home Values in the Area
Average Home Value in this Area
Purchase History
| Date | Buyer | Sale Price | Title Company |
|---|---|---|---|
| Flitsch Melvin L | $126,500 | None Available | |
| Gralund Todd W | -- | All American Escrow & Title | |
| Gralund Todd W | $82,500 | -- |
Source: Public Records
Mortgage History
| Date | Status | Borrower | Loan Amount |
|---|---|---|---|
| Open | Flitsch Melvin L | $88,830 | |
| Previous Owner | Gralund Todd W | $115,710 | |
| Previous Owner | Gralund Todd W | $82,957 |
Source: Public Records
Tax History Compared to Growth
Tax History
| Year | Tax Paid | Tax Assessment Tax Assessment Total Assessment is a certain percentage of the fair market value that is determined by local assessors to be the total taxable value of land and additions on the property. | Land | Improvement |
|---|---|---|---|---|
| 2025 | $2,410 | $173,200 | $31,200 | $142,000 |
| 2024 | $2,862 | $155,100 | $25,300 | $129,800 |
| 2023 | $2,862 | $146,600 | $25,300 | $121,300 |
| 2022 | $2,714 | $144,600 | $25,300 | $119,300 |
| 2021 | $2,522 | $140,000 | $25,300 | $114,700 |
| 2020 | $2,522 | $122,900 | $20,800 | $102,100 |
| 2019 | $2,490 | $124,000 | $17,900 | $106,100 |
| 2018 | $2,416 | $124,000 | $17,900 | $106,100 |
| 2017 | $2,314 | $114,800 | $17,900 | $96,900 |
| 2016 | $2,481 | $116,700 | $17,900 | $98,800 |
| 2015 | $2,373 | $111,544 | $17,850 | $93,694 |
| 2014 | $2,188 | $111,544 | $17,850 | $93,694 |
| 2013 | $2,138 | $111,544 | $17,850 | $93,694 |
Source: Public Records
Map
Nearby Homes
- 2601 Teresa Dr SW
- 2321 Lauren Dr SW
- 51 29th Avenue Dr SW Unit D11
- 51 29th Avenue Dr SW Unit C22
- 2955 Bowling St SW Unit E238
- 2212 Deborah Dr SW
- 42 Park Village Ave SW
- 3010 Bowling St SW
- 2401 Victoria Dr SW
- 2937 Southland St SW
- 2818 Southland St SW
- 9 33rd Ave SW
- 3212 Southland St SW
- 90 29th Ave SW
- 2021 Hamilton St SW
- 186 22nd Ave SW
- Lot A-D 41st Avenue Dr SW
- 148 33rd Ave SW
- 0 Rompot St SE
- 1756 Mallory St SW
- 2663 Fruitland Blvd SW
- 2673 Fruitland Blvd SW
- 2666 Fruitland Blvd SW
- 2653 Fruitland Blvd SW
- 2681 Fruitland Blvd SW
- 2662 Fruitland Blvd SW
- 2672 Fruitland Blvd SW
- 2687 Fruitland Blvd SW
- 2652 Fruitland Blvd SW
- 2693 Fruitland Blvd SW
- 2646 Fruitland Blvd SW
- 2642 Fruitland Blvd SW
- 2637 Fruitland Blvd SW
- 2699 Fruitland Blvd SW
- 2674 Fruitland Blvd SW
- 2636 Fruitland Blvd SW
- 2633 Fruitland Blvd SW
- 2801 Fruitland Blvd SW
- 2630 Fruitland Blvd SW
- 2696 Fruitland Blvd SW