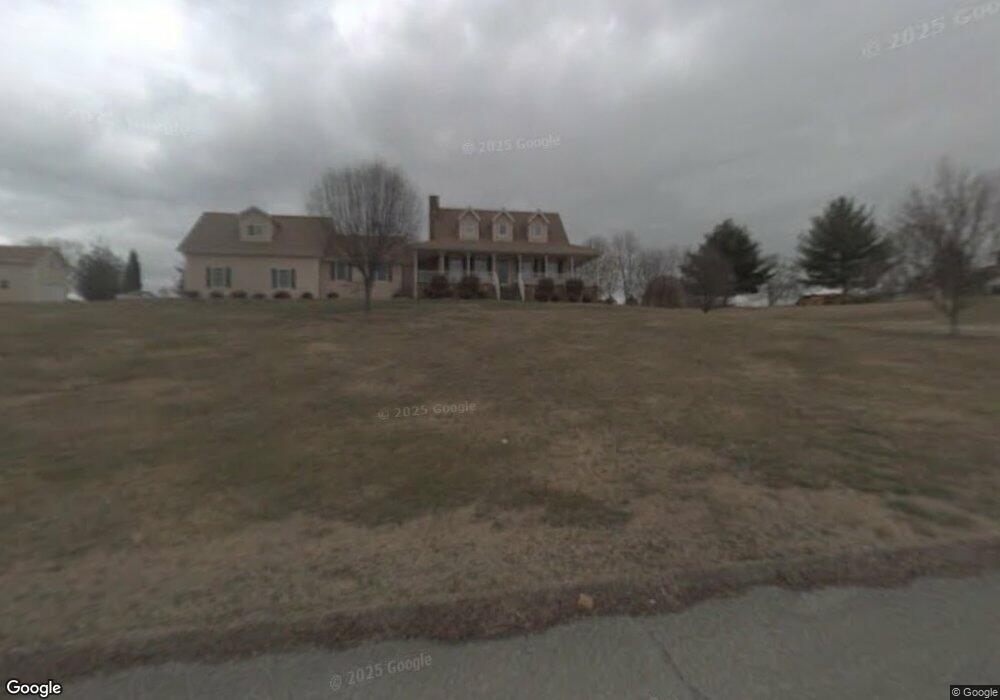
2667 Lakemont Cir Morristown, TN 37814
Estimated Value: $377,351 - $486,000
--
Bed
3
Baths
2,793
Sq Ft
$149/Sq Ft
Est. Value
About This Home
This home is located at 2667 Lakemont Cir, Morristown, TN 37814 and is currently estimated at $416,588, approximately $149 per square foot. 2667 Lakemont Cir is a home located in Hamblen County with nearby schools including Russellville Elementary School, East Ridge Middle School, and Morristown East High School.
Ownership History
Date
Name
Owned For
Owner Type
Purchase Details
Closed on
Sep 28, 2007
Sold by
Romines James C
Bought by
Morgan Samuel H
Current Estimated Value
Home Financials for this Owner
Home Financials are based on the most recent Mortgage that was taken out on this home.
Original Mortgage
$259,900
Outstanding Balance
$163,948
Interest Rate
6.41%
Estimated Equity
$252,640
Purchase Details
Closed on
Sep 23, 1994
Bought by
Atkins Tony A
Purchase Details
Closed on
Jul 5, 1991
Bought by
Buchanan Eric W and Buchanan Lisa M
Purchase Details
Closed on
May 13, 1991
Bought by
Buchanan Ollie
Purchase Details
Closed on
Dec 8, 1988
Bought by
White James Lynn and Vance Susan Dian
Purchase Details
Closed on
Dec 6, 1988
Bought by
White James Lynn and Vance Susan Dian
Purchase Details
Closed on
Nov 26, 1988
Bought by
White James Lynn and Vance Susan Dian
Purchase Details
Closed on
Jan 10, 1986
Bought by
Williams Robert L and Williams Peggy S
Purchase Details
Closed on
Feb 14, 1983
Bought by
Jones Dean
Create a Home Valuation Report for This Property
The Home Valuation Report is an in-depth analysis detailing your home's value as well as a comparison with similar homes in the area
Home Values in the Area
Average Home Value in this Area
Purchase History
| Date | Buyer | Sale Price | Title Company |
|---|---|---|---|
| Morgan Samuel H | $259,900 | -- | |
| Atkins Tony A | $88,800 | -- | |
| Buchanan Eric W | $80,000 | -- | |
| Buchanan Ollie | $80,000 | -- | |
| White James Lynn | -- | -- | |
| White James Lynn | -- | -- | |
| White James Lynn | -- | -- | |
| Williams Robert L | -- | -- | |
| Jones Dean | -- | -- |
Source: Public Records
Mortgage History
| Date | Status | Borrower | Loan Amount |
|---|---|---|---|
| Open | Jones Dean | $259,900 |
Source: Public Records
Tax History Compared to Growth
Tax History
| Year | Tax Paid | Tax Assessment Tax Assessment Total Assessment is a certain percentage of the fair market value that is determined by local assessors to be the total taxable value of land and additions on the property. | Land | Improvement |
|---|---|---|---|---|
| 2024 | $1,274 | $64,675 | $10,050 | $54,625 |
| 2023 | $1,274 | $64,675 | $0 | $0 |
| 2022 | $1,274 | $64,675 | $10,050 | $54,625 |
| 2021 | $1,274 | $64,675 | $10,050 | $54,625 |
| 2020 | $1,274 | $64,675 | $10,050 | $54,625 |
| 2019 | $1,246 | $58,500 | $14,750 | $43,750 |
| 2018 | $1,246 | $58,500 | $14,750 | $43,750 |
| 2017 | $1,246 | $58,500 | $14,750 | $43,750 |
| 2016 | $1,164 | $58,500 | $14,750 | $43,750 |
| 2015 | $1,082 | $58,500 | $14,750 | $43,750 |
| 2014 | -- | $58,500 | $14,750 | $43,750 |
| 2013 | -- | $58,900 | $0 | $0 |
Source: Public Records
Map
Nearby Homes
- 2551 Cedar Creek Rd
- 5110 Anne Cir
- 4959 Brights Pike
- 4119 Azalea Ct
- 5601 Brights Pike
- 5556 Denton Dr
- 4801 Harbor Dr
- 3800 Dan Dr
- 4547 Brights Pike
- Lot 17 Waters Edge Dr
- 4475 Copeland Dr
- 5659 Browning Way
- 1708 Boardwalk Cir
- 4146 Leslie Dr
- 3835 High Oak Dr
- 2145 Fall Creek Rd
- 4110 Harbor View Dr
- 4086 Harbor View Dr
- 5085 Old Kentucky Rd
- 2651 Lakemont Cir
- 2557 Lakemont Cir
- 2672 Lakemont Cir
- 2660 Lakemont Cir
- 2597 Lakemont Cir
- 2541 Lakemont Cir
- 2647 Lakemont Cir
- 2593 Lakemont Cir
- 2533 Lakemont Cir
- 2623 Lakemont Cir
- 2686 Lakemont Cir
- 2654 Lakemont Cir
- 2561 Lakemont Cir
- 2587 Lakemont Cir
- 2696 Lakemont Cir
- 2544 Lakemont Cir
- 2579 Lakemont Cir
- 2554 Lakemont Cir
- 2642 Lakemont Cir
- 2590 Lakemont Cir