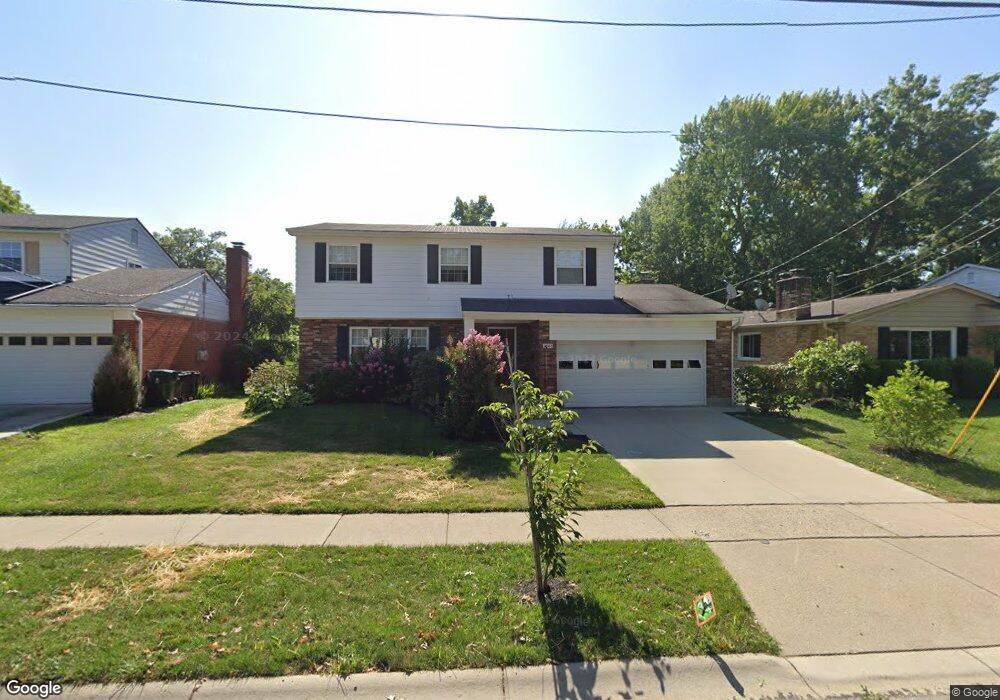
2668 Wayward Winds Dr Cincinnati, OH 45230
Mount Washington NeighborhoodEstimated Value: $333,000 - $374,000
4
Beds
3
Baths
1,841
Sq Ft
$189/Sq Ft
Est. Value
About This Home
This home is located at 2668 Wayward Winds Dr, Cincinnati, OH 45230 and is currently estimated at $347,560, approximately $188 per square foot. 2668 Wayward Winds Dr is a home located in Hamilton County with nearby schools including Mt. Washington Elementary School, Clark Montessori High School, and Shroder High School.
Ownership History
Date
Name
Owned For
Owner Type
Purchase Details
Closed on
Oct 12, 2006
Sold by
Walsh Cynthia M and Oakenfull Gillian L
Bought by
Schmitz Jenna E
Current Estimated Value
Home Financials for this Owner
Home Financials are based on the most recent Mortgage that was taken out on this home.
Original Mortgage
$169,600
Outstanding Balance
$97,866
Interest Rate
5.87%
Mortgage Type
New Conventional
Estimated Equity
$249,694
Purchase Details
Closed on
Sep 30, 2004
Sold by
Walsh Cynthia M
Bought by
Walsh Cynthia M and Oakenfull Gillian L
Purchase Details
Closed on
Oct 1, 1996
Sold by
Maynard Dalton Lee and Maynard Betty S
Bought by
Ossola Michael A and Ossola Kathleen M
Home Financials for this Owner
Home Financials are based on the most recent Mortgage that was taken out on this home.
Original Mortgage
$106,200
Interest Rate
8%
Create a Home Valuation Report for This Property
The Home Valuation Report is an in-depth analysis detailing your home's value as well as a comparison with similar homes in the area
Home Values in the Area
Average Home Value in this Area
Purchase History
| Date | Buyer | Sale Price | Title Company |
|---|---|---|---|
| Schmitz Jenna E | $212,000 | Oxford Title Agency Inc | |
| Walsh Cynthia M | -- | None Available | |
| Ossola Michael A | $118,000 | -- |
Source: Public Records
Mortgage History
| Date | Status | Borrower | Loan Amount |
|---|---|---|---|
| Open | Schmitz Jenna E | $169,600 | |
| Previous Owner | Ossola Michael A | $106,200 |
Source: Public Records
Tax History Compared to Growth
Tax History
| Year | Tax Paid | Tax Assessment Tax Assessment Total Assessment is a certain percentage of the fair market value that is determined by local assessors to be the total taxable value of land and additions on the property. | Land | Improvement |
|---|---|---|---|---|
| 2024 | $5,383 | $89,779 | $9,485 | $80,294 |
| 2023 | $5,499 | $89,779 | $9,485 | $80,294 |
| 2022 | $4,352 | $63,690 | $7,725 | $55,965 |
| 2021 | $4,190 | $63,690 | $7,725 | $55,965 |
| 2020 | $4,308 | $63,690 | $7,725 | $55,965 |
| 2019 | $4,133 | $55,867 | $6,776 | $49,091 |
| 2018 | $4,139 | $55,867 | $6,776 | $49,091 |
| 2017 | $3,935 | $55,867 | $6,776 | $49,091 |
| 2016 | $3,802 | $53,179 | $6,776 | $46,403 |
| 2015 | $3,426 | $53,179 | $6,776 | $46,403 |
| 2014 | $3,451 | $53,179 | $6,776 | $46,403 |
| 2013 | $3,510 | $53,179 | $6,776 | $46,403 |
Source: Public Records
Map
Nearby Homes
- 5463 Hanover Cir
- 5459 Hanover Cir
- 2536 Ranchvale Dr
- 6189 Wasigo Dr
- 2560 Coveyrun Ct
- 5308 Reserve Cir
- 2904 Turpin Lake Place
- 2454 Doeview Ct
- 2456 Doeview Ct
- 2447 Coveyrun S
- 6426 Silverfox Dr
- 2453 Sanctuary Cir
- 2475 Walnutview Ct
- 6279 Crestview Place
- 6436 Wildhaven Way
- 6530 Silverfox Dr
- 6196 Turpin Hills Dr
- 6071 Tridale Ct
- 6519 Rainbow Ln
- 2664 Wayward Winds Dr
- 2660 Wayward Winds Dr
- 2661 Bonnie Dr
- 2676 Wayward Winds Dr
- 2657 Bonnie Dr
- 2665 Bonnie Dr
- 2671 Wayward Winds Dr
- 2627 Wayward Winds Dr
- 2675 Wayward Winds Dr
- 2665 Wayward Winds Dr
- 2653 Bonnie Dr
- 2675 Bonnie Dr
- 2680 Wayward Winds Dr
- 2656 Wayward Winds Dr
- 2647 Bonnie Dr
- 2681 Wayward Winds Dr
- 2681 Bonnie Dr
- 5480 Hokel Ln
- 2652 Wayward Winds Dr
- 2703 Bonnie Dr