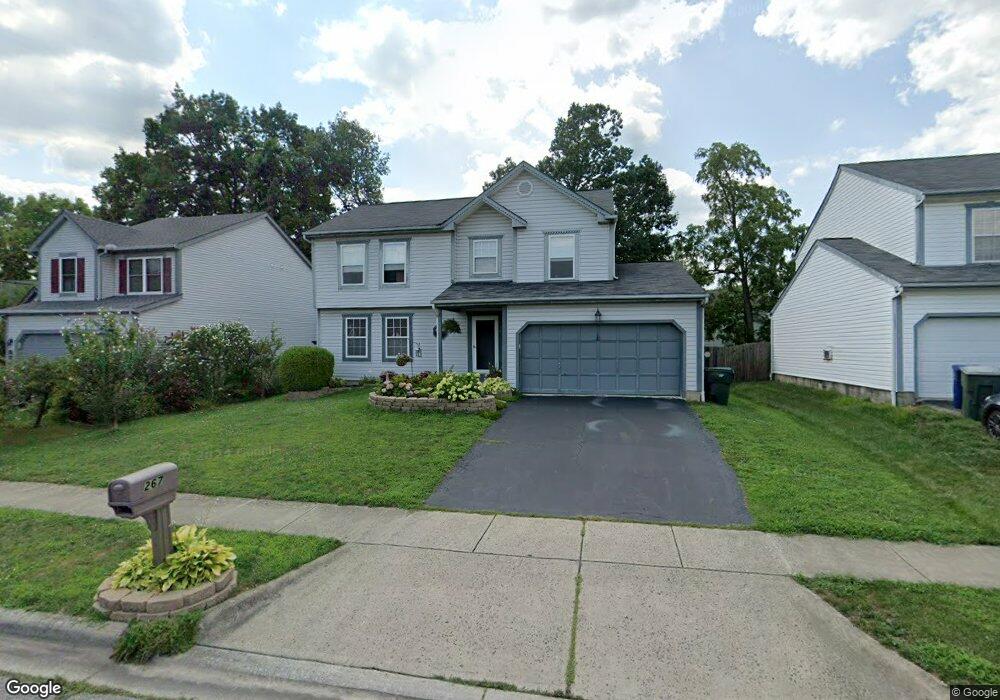
267 Charing Cross St Galloway, OH 43119
Westchester-Green Countrie NeighborhoodEstimated Value: $321,000 - $338,000
3
Beds
3
Baths
1,908
Sq Ft
$171/Sq Ft
Est. Value
About This Home
This home is located at 267 Charing Cross St, Galloway, OH 43119 and is currently estimated at $326,327, approximately $171 per square foot. 267 Charing Cross St is a home located in Franklin County with nearby schools including Darby Woods Elementary School, Galloway Ridge Intermediate School, and Norton Middle School.
Ownership History
Date
Name
Owned For
Owner Type
Purchase Details
Closed on
Aug 15, 2008
Sold by
Abshire Karen Dee and Abshire John J
Bought by
Hunter Matthew F and Edgeworth Kristen J
Current Estimated Value
Home Financials for this Owner
Home Financials are based on the most recent Mortgage that was taken out on this home.
Original Mortgage
$112,000
Outstanding Balance
$73,725
Interest Rate
6.39%
Mortgage Type
Purchase Money Mortgage
Estimated Equity
$252,602
Purchase Details
Closed on
May 20, 1997
Sold by
Maronda Homes Inc
Bought by
Abshire Karen Dee
Home Financials for this Owner
Home Financials are based on the most recent Mortgage that was taken out on this home.
Original Mortgage
$98,850
Interest Rate
8.27%
Purchase Details
Closed on
Sep 12, 1994
Sold by
R & T Land Ptns
Bought by
Italia Homes Inc
Home Financials for this Owner
Home Financials are based on the most recent Mortgage that was taken out on this home.
Original Mortgage
$90,000
Interest Rate
8.65%
Mortgage Type
New Conventional
Create a Home Valuation Report for This Property
The Home Valuation Report is an in-depth analysis detailing your home's value as well as a comparison with similar homes in the area
Home Values in the Area
Average Home Value in this Area
Purchase History
| Date | Buyer | Sale Price | Title Company |
|---|---|---|---|
| Hunter Matthew F | $140,000 | Independent | |
| Abshire Karen Dee | $116,400 | Chicago Title | |
| Italia Homes Inc | $120,000 | -- |
Source: Public Records
Mortgage History
| Date | Status | Borrower | Loan Amount |
|---|---|---|---|
| Open | Hunter Matthew F | $112,000 | |
| Closed | Abshire Karen Dee | $98,850 | |
| Previous Owner | Italia Homes Inc | $90,000 |
Source: Public Records
Tax History Compared to Growth
Tax History
| Year | Tax Paid | Tax Assessment Tax Assessment Total Assessment is a certain percentage of the fair market value that is determined by local assessors to be the total taxable value of land and additions on the property. | Land | Improvement |
|---|---|---|---|---|
| 2024 | $3,529 | $96,780 | $26,250 | $70,530 |
| 2023 | $3,466 | $96,775 | $26,250 | $70,525 |
| 2022 | $2,607 | $53,410 | $6,580 | $46,830 |
| 2021 | $2,659 | $53,410 | $6,580 | $46,830 |
| 2020 | $2,637 | $53,270 | $6,580 | $46,690 |
| 2019 | $2,437 | $43,440 | $5,250 | $38,190 |
| 2018 | $2,421 | $43,440 | $5,250 | $38,190 |
| 2017 | $2,414 | $43,440 | $5,250 | $38,190 |
| 2016 | $2,416 | $39,940 | $6,790 | $33,150 |
| 2015 | $2,416 | $39,940 | $6,790 | $33,150 |
| 2014 | $2,419 | $39,940 | $6,790 | $33,150 |
| 2013 | $1,411 | $46,970 | $7,980 | $38,990 |
Source: Public Records
Map
Nearby Homes
- 429 Postle Blvd
- 5728 Greendale Dr
- 477 Clairbrook Ave
- 417 Pamlico St Unit JK2
- 354 Fernhill Ave
- 452 Pamlico St Unit 9
- 491 Clairbrook Ave Unit 3
- 515 Clairbrook Ave
- 542 Clairbrook Ave Unit 11
- 110 Pasadena Ave
- 40 Gladys Rd
- 5409 Longworth Dr
- 5722 Silver Spurs Ln
- 5824 Hunting Hollow Ct Unit 5824-5826
- 264 Woodlawn Ave
- 5006 Old Tree Ave
- 631 Dlyn St Unit 12
- 5715 Oyster Bay Way
- 435 Redmond Rd
- 5504 Inglecrest Place
- 275 Charing Cross St
- 259 Charing Cross St
- 5663 Bentonhurst Ct
- 283 Charing Cross St
- 262 Eastcreek Dr
- 251 Charing Cross St
- 268 Eastcreek Dr
- 256 Eastcreek Dr
- 5478 Bentonhurst Ct
- 274 Eastcreek Dr
- 248 Eastcreek Dr
- 243 Charing Cross St
- 291 Charing Cross St
- 280 Eastcreek Dr
- 5470 Bentonhurst Ct
- 240 Eastcreek Dr
- 236 Charing Cross St
- 5481 Bentonhurst Ct
- 235 Charing Cross St
- 297 Charing Cross St