Estimated Value: $3,457,014 - $3,832,000
3
Beds
3
Baths
4,135
Sq Ft
$863/Sq Ft
Est. Value
About This Home
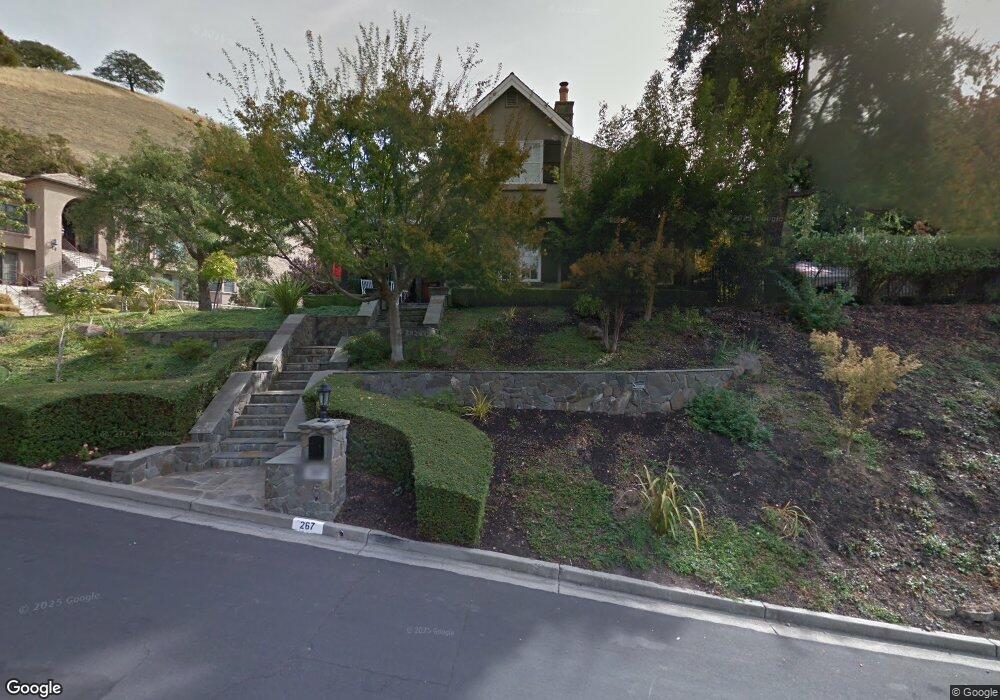
This home is located at 267 Las Quebradas, Alamo, CA 94507 and is currently estimated at $3,566,504, approximately $862 per square foot. 267 Las Quebradas is a home located in Contra Costa County with nearby schools including Stone Valley Middle School, Monte Vista High School, and St. Isidore School.
Ownership History
Date
Name
Owned For
Owner Type
Purchase Details
Closed on
Jul 29, 2015
Sold by
Mckenna James C and Mckenna Mary Ellen
Bought by
Mckenna Family Trust
Current Estimated Value
Purchase Details
Closed on
Mar 30, 2006
Sold by
Dresdow Gregory K and Dresdow Diane M
Bought by
Mckenna James C and Mckenna Mary Ellen
Home Financials for this Owner
Home Financials are based on the most recent Mortgage that was taken out on this home.
Original Mortgage
$262,000
Outstanding Balance
$149,168
Interest Rate
6.2%
Mortgage Type
Credit Line Revolving
Estimated Equity
$3,417,336
Purchase Details
Closed on
Mar 27, 2000
Sold by
Dresdow Gregory K and Dresdow Diane
Bought by
Dresdow Gregory K and Dresdow Diane M
Purchase Details
Closed on
Aug 6, 1999
Sold by
Dresdow Gregory K and Dresdow Diane
Bought by
Dresdow Gregory K and Dresdow Diane M
Create a Home Valuation Report for This Property
The Home Valuation Report is an in-depth analysis detailing your home's value as well as a comparison with similar homes in the area
Home Values in the Area
Average Home Value in this Area
Purchase History
| Date | Buyer | Sale Price | Title Company |
|---|---|---|---|
| Mckenna Family Trust | -- | None Available | |
| Mckenna James C | $2,225,000 | Financial Title Company | |
| Dresdow Gregory K | -- | -- | |
| Dresdow Gregory K | -- | -- |
Source: Public Records
Mortgage History
| Date | Status | Borrower | Loan Amount |
|---|---|---|---|
| Open | Mckenna James C | $262,000 | |
| Open | Mckenna James C | $1,500,000 |
Source: Public Records
Tax History
| Year | Tax Paid | Tax Assessment Tax Assessment Total Assessment is a certain percentage of the fair market value that is determined by local assessors to be the total taxable value of land and additions on the property. | Land | Improvement |
|---|---|---|---|---|
| 2025 | $35,473 | $3,186,507 | $1,161,590 | $2,024,917 |
| 2024 | $31,385 | $3,050,000 | $1,111,829 | $1,938,171 |
| 2023 | $31,385 | $2,800,000 | $1,020,696 | $1,779,304 |
| 2022 | $29,246 | $2,572,000 | $938,000 | $1,634,000 |
| 2021 | $27,691 | $2,436,000 | $888,000 | $1,548,000 |
| 2019 | $26,853 | $2,339,000 | $852,646 | $1,486,354 |
| 2018 | $24,831 | $2,200,000 | $801,976 | $1,398,024 |
| 2017 | $23,247 | $2,093,000 | $762,970 | $1,330,030 |
| 2016 | $21,642 | $1,927,500 | $702,640 | $1,224,860 |
| 2015 | $20,493 | $1,816,000 | $661,994 | $1,154,006 |
| 2014 | $19,354 | $1,700,000 | $619,709 | $1,080,291 |
Source: Public Records
Map
Nearby Homes
- 401 Legacy Dr
- 13 Kemp Ct
- 125 Mystic Place
- 320 Miranda Ln
- 3144 Roundhill Rd
- 46 Tam o Shanter Rd
- 908 Gibson Ct
- 1536 Serafix Rd
- 218 Erselia Trail
- 2402 Royal Oaks Dr
- 145 Sugar Creek Ln
- 930 Pinto Ct
- 321 Livorna Heights Rd
- 1016 Stone Valley Rd
- 2358 Stone Valley Rd
- 44 Lariat Ct
- 100 Los Balcones
- 2530 Roundhill Dr
- 2257 Gladwin Dr
- 44 Hagen Oaks Ct
- 263 Las Quebradas
- 299 Las Quebradas
- 273 Las Quebradas
- 266 Las Quebradas
- 274 Las Quebradas
- 259 Las Quebradas
- 297 Las Quebradas
- 282 Las Quebradas
- 3077 Oakraider Dr
- 253 Las Quebradas
- 3073 Oakraider Dr
- 295 Las Quebradas
- 290 Las Quebradas
- 249 Las Quebradas
- 3068 Oakraider Dr
- 298 Las Quebradas
- 3061 Oakraider Dr
- 241 Las Quebradas
- 245 Las Quebradas
- 3069 Oakraider Dr
Your Personal Tour Guide
Ask me questions while you tour the home.