Estimated Value: $1,037,000 - $1,269,000
3
Beds
3
Baths
1,934
Sq Ft
$584/Sq Ft
Est. Value
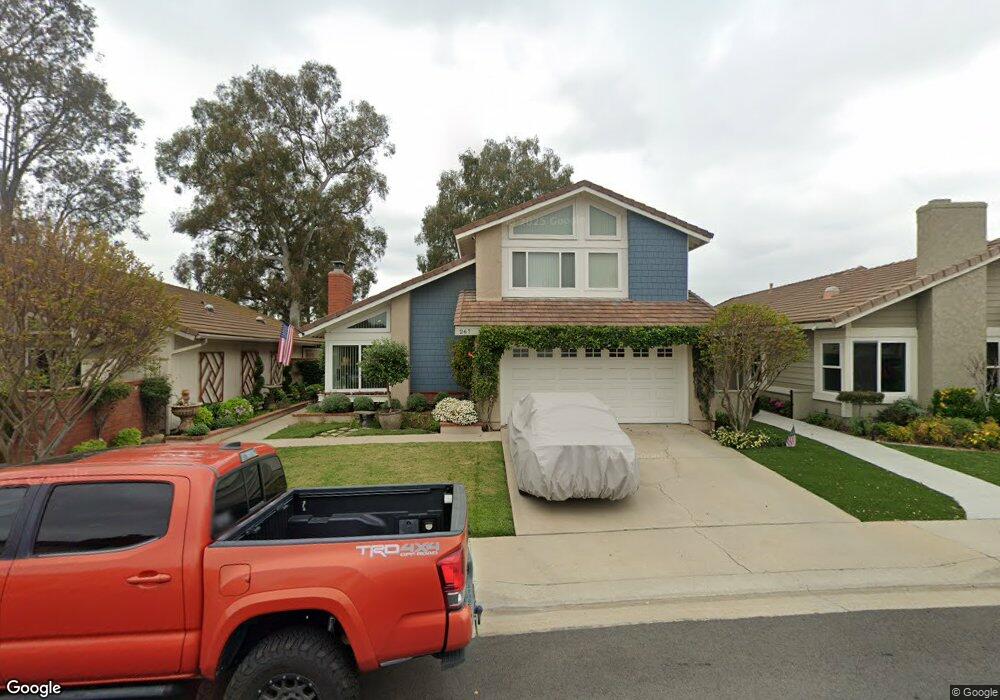
About This Home
This home is located at 267 Longbranch Cir, Brea, CA 92821 and is currently estimated at $1,129,875, approximately $584 per square foot. 267 Longbranch Cir is a home located in Orange County with nearby schools including Brea Country Hills Elementary School, Brea Junior High School, and Brea-Olinda High School.
Ownership History
Date
Name
Owned For
Owner Type
Purchase Details
Closed on
Apr 21, 1998
Sold by
Jose Salas and Jose Gloria
Bought by
Robidoux David P and Robidoux Lisa A
Current Estimated Value
Home Financials for this Owner
Home Financials are based on the most recent Mortgage that was taken out on this home.
Original Mortgage
$218,400
Outstanding Balance
$41,278
Interest Rate
7.05%
Estimated Equity
$1,088,597
Purchase Details
Closed on
Dec 26, 1993
Sold by
Salas Gloria A and Juarez Benny
Bought by
Salas Jose L and Salas Gloria A
Home Financials for this Owner
Home Financials are based on the most recent Mortgage that was taken out on this home.
Original Mortgage
$146,500
Interest Rate
7.09%
Purchase Details
Closed on
Sep 23, 1993
Sold by
Salas Jose L
Bought by
Salas Gloria A and Juarez Benny
Create a Home Valuation Report for This Property
The Home Valuation Report is an in-depth analysis detailing your home's value as well as a comparison with similar homes in the area
Home Values in the Area
Average Home Value in this Area
Purchase History
| Date | Buyer | Sale Price | Title Company |
|---|---|---|---|
| Robidoux David P | $225,500 | First American Title Ins Co | |
| Salas Jose L | -- | First American Title Ins Co | |
| Salas Jose L | -- | -- | |
| Juarez Benny | -- | Continental Lawyers Title Co | |
| Salas Gloria A | -- | Continental Lawyers Title Co | |
| Salas Jose L | -- | Continental Lawyers Title Co |
Source: Public Records
Mortgage History
| Date | Status | Borrower | Loan Amount |
|---|---|---|---|
| Open | Robidoux David P | $218,400 | |
| Previous Owner | Juarez Benny | $146,500 |
Source: Public Records
Tax History
| Year | Tax Paid | Tax Assessment Tax Assessment Total Assessment is a certain percentage of the fair market value that is determined by local assessors to be the total taxable value of land and additions on the property. | Land | Improvement |
|---|---|---|---|---|
| 2025 | $4,179 | $359,577 | $187,472 | $172,105 |
| 2024 | $4,179 | $352,527 | $183,796 | $168,731 |
| 2023 | $4,061 | $345,615 | $180,192 | $165,423 |
| 2022 | $4,019 | $338,839 | $176,659 | $162,180 |
| 2021 | $3,943 | $332,196 | $173,196 | $159,000 |
| 2020 | $3,916 | $328,790 | $171,420 | $157,370 |
| 2019 | $3,813 | $322,344 | $168,059 | $154,285 |
| 2018 | $3,755 | $316,024 | $164,764 | $151,260 |
| 2017 | $3,684 | $309,828 | $161,533 | $148,295 |
| 2016 | $3,611 | $303,753 | $158,365 | $145,388 |
| 2015 | $3,560 | $299,191 | $155,986 | $143,205 |
| 2014 | $3,456 | $293,331 | $152,931 | $140,400 |
Source: Public Records
Map
Nearby Homes
- 136 Donnybrook Rd
- 2304 Carrotwood Dr
- 2418 Rainbow Ln
- 570 Olive Ave
- 2363 Morning Dew Dr
- 2583 Sandpebble Ln
- 1796 Ravencrest Dr
- 2761 E Stearns St
- 360 Meadow Ct
- 500 Silver Canyon Way
- 640 Cliffwood Ave
- 673 Cliffwood Ave
- 2976 E Coalinga Dr
- 878 N Landa Way
- 38 Rogers Ct
- 145 S Poplar Ave Unit 20
- 2851 Rolling Hills Dr Unit 178
- 2851 Rolling Hills Dr Unit 257
- 2851 Rolling Hills Dr Unit 248
- 2851 Rolling Hills Dr
- 275 Longbranch Cir
- 259 Longbranch Cir
- 283 Longbranch Cir
- 251 Longbranch Cir
- 291 Longbranch Cir
- 243 Longbranch Cir
- 274 Longbranch Cir
- 266 Longbranch Cir
- 282 Longbranch Cir
- 258 Longbranch Cir
- 235 Longbranch Cir
- 299 Longbranch Cir
- 252 Waterwheel Ln
- 290 Longbranch Cir
- 258 Waterwheel Ln
- 264 Waterwheel Ln
- 250 Longbranch Cir
- 298 Longbranch Cir
- 175 Waterfall Ln
- 246 Waterwheel Ln
Your Personal Tour Guide
Ask me questions while you tour the home.