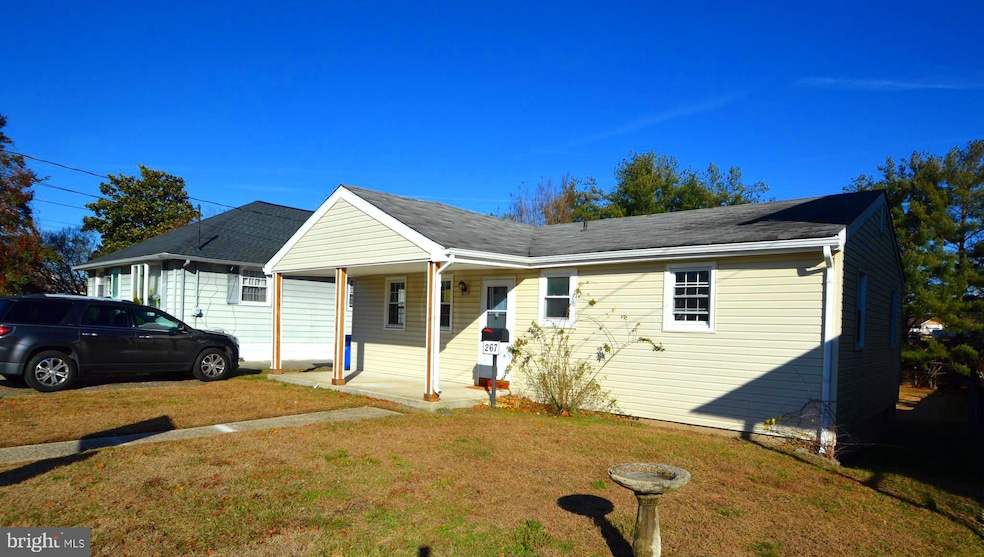
267 Mott Ave Burlington, NJ 08016
Highlights
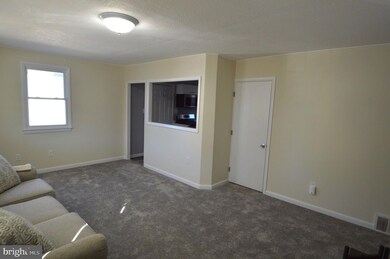
- Rambler Architecture
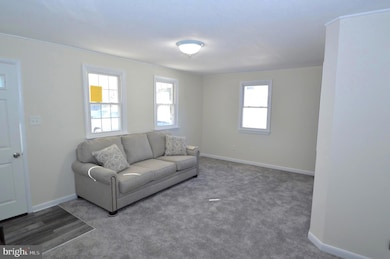
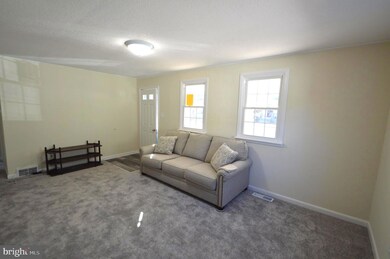
- Living Room
- Forced Air Heating and Cooling System
About This Home
This home is located at 267 Mott Ave, Burlington, NJ 08016 and is currently priced at $2,400. This property was built in 1964. 267 Mott Ave is a home located in Burlington County with nearby schools including Burlington City High School, St Paul's Parochial School, and Doane Academy.
Home Details
Home Type
- Single Family
Year Built
- Built in 1964
Lot Details
- 7,497 Sq Ft Lot
- Lot Dimensions are 50.00 x 150.00
- Property is zoned OS-1
Home Design
- Rambler Architecture
- Block Foundation
- Frame Construction
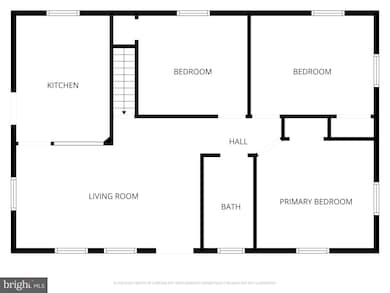
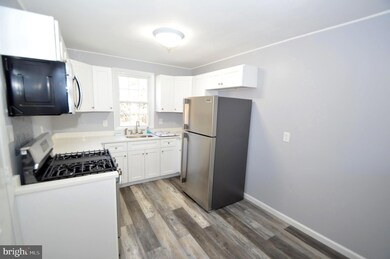
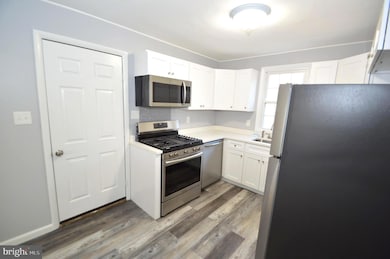
Interior Spaces
- 864 Sq Ft Home
- Property has 1 Level
- Living Room
- Basement Fills Entire Space Under The House
Bedrooms and Bathrooms
- 3 Main Level Bedrooms
- 1 Full Bathroom
Parking
- 2 Parking Spaces
- 2 Driveway Spaces
Location
- Flood Risk
Utilities
- Forced Air Heating and Cooling System
- Natural Gas Water Heater
Listing and Financial Details
- Residential Lease
- Security Deposit $3,600
- 12-Month Lease Term
- Available 12/19/25
- Assessor Parcel Number 05-00038-00005
Community Details
Overview
- None Ava Ilable Subdivision
Pet Policy
- No Pets Allowed
Map
Property History
| Date | Event | Price | List to Sale | Price per Sq Ft |
|---|---|---|---|---|
| 12/09/2025 12/09/25 | For Rent | $2,400 | -- | -- |
Source: Bright MLS
MLS Number: NJBL2102212
APN: 05-00038-0000-00005
Disclaimer: Certain information contained herein is derived from information provided by parties other than Homes.com. All information provided is deemed reliable, but is not guaranteed to be accurate and should be independently verified.
![]() The data relating to real estate for sale on this website appears in part through the BRIGHT Internet Data Exchange program, a voluntary cooperative exchange of property listing data between licensed real estate brokerage firms, and is provided by BRIGHT through a licensing agreement.
The data relating to real estate for sale on this website appears in part through the BRIGHT Internet Data Exchange program, a voluntary cooperative exchange of property listing data between licensed real estate brokerage firms, and is provided by BRIGHT through a licensing agreement.
Listing information is from various brokers who participate in the Bright MLS IDX program and not all listings may be visible on the site.
The property information being provided on or through the website is for the personal, non-commercial use of consumers and such information may not be used for any purpose other than to identify prospective properties consumers may be interested in purchasing.
Some properties which appear for sale on the website may no longer be available because they are for instance, under contract, sold or are no longer being offered for sale.
Property information displayed is deemed reliable but is not guaranteed.
Copyright 2025 Bright MLS, Inc.
- 601 High St
- 17 E Federal St
- 133 E Federal St
- 406 High St Unit 2
- 0 E Broad St Unit A
- 412 Lawrence St
- 328 High St
- 328 High St
- 38 Peregrine Way
- 71 Peregrine Way
- 424 York St
- 15 W Union St Unit 1
- 205 Jones Ave Unit 2
- 200 E Broad St Unit 7
- 322 Jones Ave
- 312 York St
- 1 E Pearl St
- 336 Barclay St Unit A
- 505 Mitchell Ave
- 1501 -03 Mount Holly Rd Unit 3
