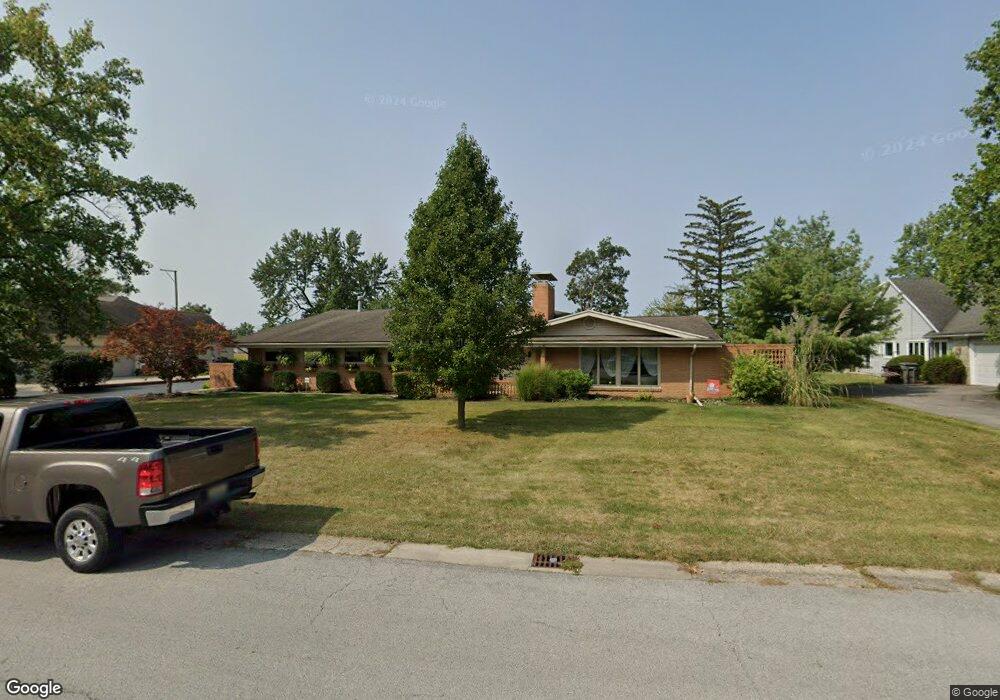
267 N Fernwood Dr Lima, OH 45805
Lakewood West NeighborhoodEstimated Value: $240,000 - $317,774
3
Beds
3
Baths
2,268
Sq Ft
$124/Sq Ft
Est. Value
About This Home
This home is located at 267 N Fernwood Dr, Lima, OH 45805 and is currently estimated at $280,194, approximately $123 per square foot. 267 N Fernwood Dr is a home located in Allen County with nearby schools including Heritage Elementary School, Lima West Middle School, and Lima North Middle School.
Ownership History
Date
Name
Owned For
Owner Type
Purchase Details
Closed on
Sep 21, 1994
Sold by
Wright Lalura
Bought by
Degrands Nicholas and Degrands Susan
Current Estimated Value
Home Financials for this Owner
Home Financials are based on the most recent Mortgage that was taken out on this home.
Original Mortgage
$139,500
Interest Rate
8.62%
Mortgage Type
New Conventional
Purchase Details
Closed on
Jan 10, 1991
Bought by
Wright Laura M
Create a Home Valuation Report for This Property
The Home Valuation Report is an in-depth analysis detailing your home's value as well as a comparison with similar homes in the area
Home Values in the Area
Average Home Value in this Area
Purchase History
| Date | Buyer | Sale Price | Title Company |
|---|---|---|---|
| Degrands Nicholas | $155,000 | -- | |
| Wright Laura M | -- | -- |
Source: Public Records
Mortgage History
| Date | Status | Borrower | Loan Amount |
|---|---|---|---|
| Closed | Degrands Nicholas | $139,500 |
Source: Public Records
Tax History Compared to Growth
Tax History
| Year | Tax Paid | Tax Assessment Tax Assessment Total Assessment is a certain percentage of the fair market value that is determined by local assessors to be the total taxable value of land and additions on the property. | Land | Improvement |
|---|---|---|---|---|
| 2024 | $3,670 | $105,220 | $15,160 | $90,060 |
| 2023 | $3,001 | $74,100 | $10,680 | $63,420 |
| 2022 | $2,988 | $74,100 | $10,680 | $63,420 |
| 2021 | $3,168 | $74,100 | $10,680 | $63,420 |
| 2020 | $3,639 | $75,260 | $10,120 | $65,140 |
| 2019 | $3,639 | $75,260 | $10,120 | $65,140 |
| 2018 | $3,410 | $75,260 | $10,120 | $65,140 |
| 2017 | $3,248 | $66,750 | $10,120 | $56,630 |
| 2016 | $3,310 | $66,750 | $10,120 | $56,630 |
| 2015 | $3,318 | $66,750 | $10,120 | $56,630 |
| 2014 | $3,318 | $66,640 | $10,780 | $55,860 |
| 2013 | $3,225 | $66,640 | $10,780 | $55,860 |
Source: Public Records
Map
Nearby Homes
- 391 N Fernwood Dr
- 2050 W Market St
- 514 N Cable Rd
- 2700 Lowell Ave
- 2100 University Blvd
- 234 S Westwood Dr
- 1912 Hillcrest Dr
- 1880 Wendell Ave
- 109 N Pears Ave
- 1753 Leland Ave
- 1630 W Market St
- N/A Eastown Rd N
- 858 Mackenzie Dr
- 704 Bentwood Dr
- 1703 W Wayne St
- 608 S Primrose Place
- 1634 W High St
- 1719 Latham Ave
- 2272 Lakewood Ave
- 2958 Hanover Dr