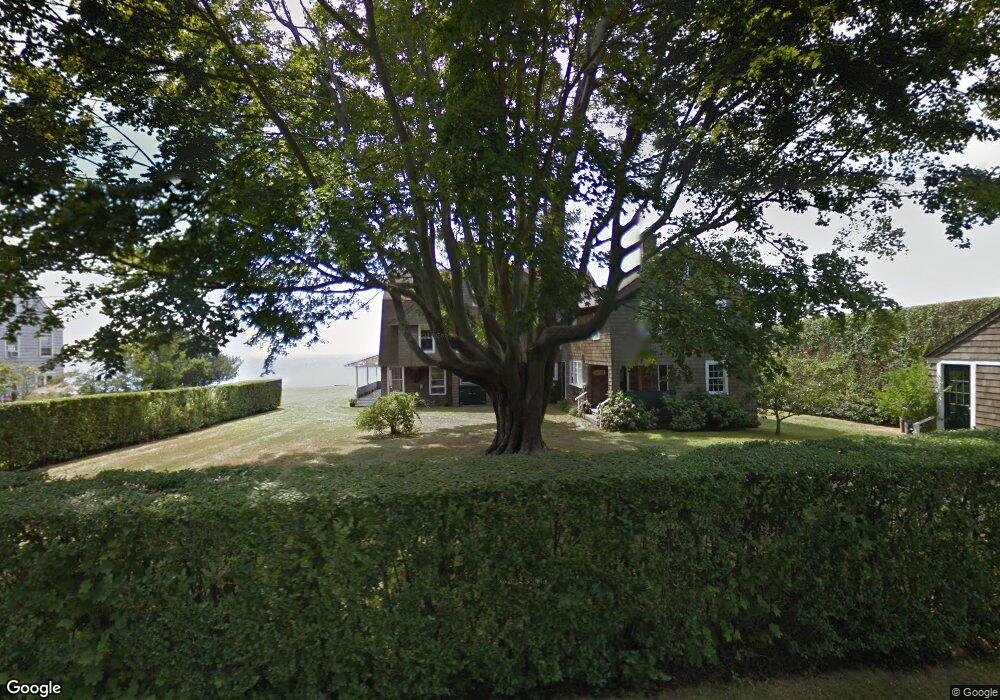
267 Old Black Point Rd Niantic, CT 06357
Estimated Value: $3,998,000 - $4,692,000
7
Beds
6
Baths
4,590
Sq Ft
$960/Sq Ft
Est. Value
About This Home
This home is located at 267 Old Black Point Rd, Niantic, CT 06357 and is currently estimated at $4,406,804, approximately $960 per square foot. 267 Old Black Point Rd is a home located in New London County with nearby schools including East Lyme Middle School, East Lyme High School, and The Light House Voc-Ed Center.
Ownership History
Date
Name
Owned For
Owner Type
Purchase Details
Closed on
Jun 17, 2025
Sold by
Pbo 267 Llc
Bought by
Harned Peter C and Harned Amy D
Current Estimated Value
Purchase Details
Closed on
Jan 17, 2014
Sold by
Lehman Susan R
Bought by
Pbo 267 Llc
Purchase Details
Closed on
Sep 13, 2011
Sold by
Lyman Anne T and Lyman Huntington Est
Bought by
Lehman-Carmichael Susan
Create a Home Valuation Report for This Property
The Home Valuation Report is an in-depth analysis detailing your home's value as well as a comparison with similar homes in the area
Home Values in the Area
Average Home Value in this Area
Purchase History
| Date | Buyer | Sale Price | Title Company |
|---|---|---|---|
| Harned Peter C | $4,400,000 | None Available | |
| Harned Peter C | $4,400,000 | None Available | |
| Pbo 267 Llc | $1,800,000 | -- | |
| Lehman-Carmichael Susan | -- | -- | |
| Pbo 267 Llc | $1,800,000 | -- | |
| Lehman-Carmichael Susan | -- | -- |
Source: Public Records
Tax History
| Year | Tax Paid | Tax Assessment Tax Assessment Total Assessment is a certain percentage of the fair market value that is determined by local assessors to be the total taxable value of land and additions on the property. | Land | Improvement |
|---|---|---|---|---|
| 2025 | $42,737 | $1,525,790 | $1,086,750 | $439,040 |
| 2024 | $40,205 | $1,525,790 | $1,086,750 | $439,040 |
| 2023 | $37,962 | $1,525,790 | $1,086,750 | $439,040 |
| 2022 | $36,375 | $1,525,790 | $1,086,750 | $439,040 |
| 2021 | $38,866 | $1,363,250 | $1,086,750 | $276,500 |
| 2020 | $38,662 | $1,363,250 | $1,086,750 | $276,500 |
| 2019 | $38,430 | $1,363,250 | $1,086,750 | $276,500 |
| 2018 | $36,940 | $1,350,650 | $1,086,750 | $263,900 |
| 2017 | $35,333 | $1,350,650 | $1,086,750 | $263,900 |
| 2016 | $39,179 | $1,544,900 | $1,253,980 | $290,920 |
| 2015 | $38,174 | $1,544,900 | $1,253,980 | $290,920 |
| 2014 | $37,124 | $1,544,900 | $1,253,980 | $290,920 |
Source: Public Records
Map
Nearby Homes
- 61 Whitecap Rd
- 15 Griswold Rd
- 36 Attawan Rd
- 26 Mohawk Dr
- 127 Black Point Rd Unit 7
- 42 S Washington Ave
- 19 Sapia Dr
- 31 Regatta Dr
- 12 Spinnaker Dr
- 18 Compass Ct
- 468 Main St Unit 318
- 468 Main St Unit 111
- 43 Village Crossing Unit 43
- 47 Village Crossing Unit 47
- 22 Riverdale Landing
- 46 Village Crossing Unit 46
- 97 W Main St Unit 36
- 55 Corey Ln
- 43 Roxbury Ct
- 185 Main St Unit 301
- 269 Old Black Point Rd
- 265 Old Black Point Rd
- 262 Old Black Point Rd
- 263 Old Black Point Rd
- 273 Old Black Point Rd
- 268 Old Black Point Rd
- 272 Old Black Point Rd
- 261 Old Black Point Rd
- 5 Hemingway Rd
- 260 Old Black Point Rd
- 9 Hemingway Rd
- 275 Old Black Point Rd
- 258 Old Black Point Rd
- 274 Old Black Point Rd
- 11 Hemingway Rd
- 257 Old Black Point Rd
- 6 Hemingway Rd
- 276 Old Black Point Rd
- 277 Old Black Point Rd
- 4 Hemingway Rd
Your Personal Tour Guide
Ask me questions while you tour the home.