Estimated Value: $122,052 - $194,000
3
Beds
2
Baths
1,155
Sq Ft
$124/Sq Ft
Est. Value
About This Home
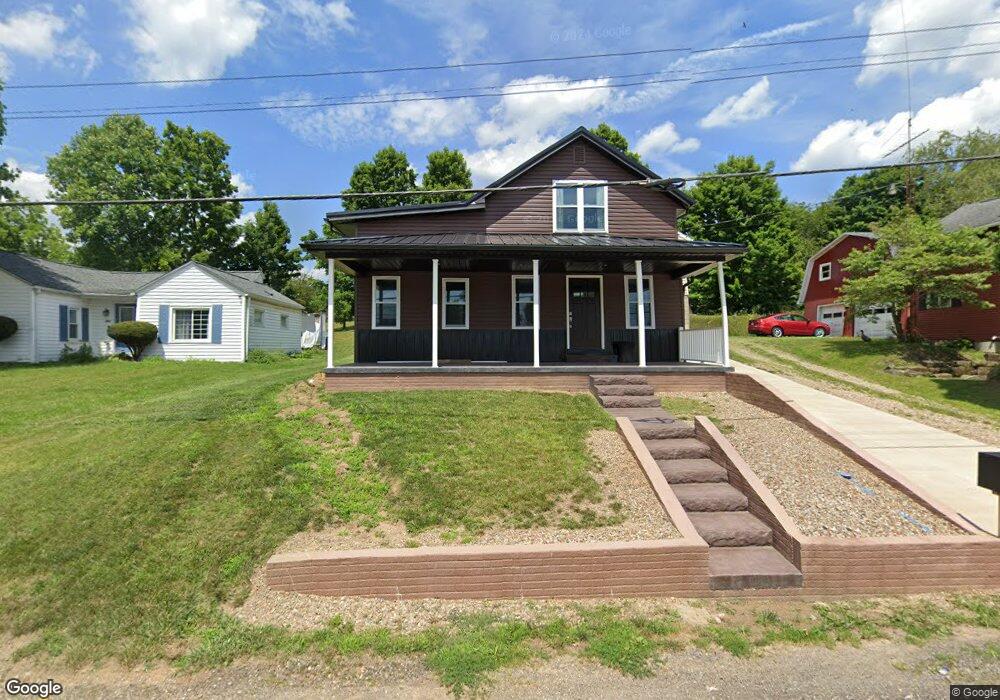
This home is located at 267 W Main St, Lucas, OH 44843 and is currently estimated at $143,263, approximately $124 per square foot. 267 W Main St is a home located in Richland County with nearby schools including Lucas Elementary School, Lucas Heritage Middle School, and Lucas High School.
Ownership History
Date
Name
Owned For
Owner Type
Purchase Details
Closed on
Jun 4, 2021
Sold by
Shreffier David C
Bought by
Miedi Lori A
Current Estimated Value
Purchase Details
Closed on
Jul 6, 2005
Sold by
Cox Jason D and Cox Holly R
Bought by
Shreffler David C
Purchase Details
Closed on
May 15, 2001
Sold by
Pohr Henry
Bought by
Messer Jason Coy Holly R
Home Financials for this Owner
Home Financials are based on the most recent Mortgage that was taken out on this home.
Original Mortgage
$70,810
Interest Rate
6.99%
Mortgage Type
New Conventional
Purchase Details
Closed on
Aug 15, 2000
Sold by
Weirick Dale E
Bought by
Pohr Henry and Pohr Jean
Purchase Details
Closed on
Jul 1, 1986
Create a Home Valuation Report for This Property
The Home Valuation Report is an in-depth analysis detailing your home's value as well as a comparison with similar homes in the area
Purchase History
| Date | Buyer | Sale Price | Title Company |
|---|---|---|---|
| Miedi Lori A | $75,000 | Chicago Title Agency | |
| Shreffler David C | $77,000 | -- | |
| Messer Jason Coy Holly R | $73,000 | -- | |
| Pohr Henry | $62,500 | -- | |
| -- | $30,000 | -- |
Source: Public Records
Mortgage History
| Date | Status | Borrower | Loan Amount |
|---|---|---|---|
| Previous Owner | Messer Jason Coy Holly R | $70,810 |
Source: Public Records
Tax History
| Year | Tax Paid | Tax Assessment Tax Assessment Total Assessment is a certain percentage of the fair market value that is determined by local assessors to be the total taxable value of land and additions on the property. | Land | Improvement |
|---|---|---|---|---|
| 2024 | $1,149 | $27,080 | $4,640 | $22,440 |
| 2023 | $1,148 | $27,080 | $4,640 | $22,440 |
| 2022 | $1,095 | $23,140 | $4,330 | $18,810 |
| 2021 | $1,093 | $23,040 | $4,330 | $18,710 |
| 2020 | $1,111 | $23,040 | $4,330 | $18,710 |
| 2019 | $1,018 | $19,850 | $3,670 | $16,180 |
| 2018 | $1,049 | $19,850 | $3,670 | $16,180 |
| 2017 | $1,041 | $19,850 | $3,670 | $16,180 |
| 2016 | $1,027 | $19,500 | $3,560 | $15,940 |
| 2015 | $1,026 | $19,500 | $3,560 | $15,940 |
| 2014 | $1,032 | $19,500 | $3,560 | $15,940 |
| 2012 | $523 | $20,110 | $3,670 | $16,440 |
Source: Public Records
Map
Nearby Homes
- 2130 State Route 39
- 27 E Main St
- 1851 State Route 39
- 2778 Lucas Perrysville Rd
- 2420 Mansfield Washington Rd
- 0 Mount Zion Rd Unit 9069748
- 0 State Route 39 & I-71 Northeast Quadrant
- 0 State Route 39 & I-71 Southeast Quadrant
- 1661 State Route 603
- 1715 Mansfield Lucas Rd
- 3405 Hastings Newville Rd
- 0 Peterson Rd
- 2515 Peterson Rd
- 0 Woodville Rd Unit Lot 14952, 14953
- 0 Woodville Rd Unit Lot 14954, 14955
- 0 Woodville Rd Unit Lot 14956, 14957,
- 0 McBride Road Parcel # 1 Unit 9066028
- 1290 Bonnie Dr
- 400 Garver Rd
- 0 Mcelroy Rd
Your Personal Tour Guide
Ask me questions while you tour the home.