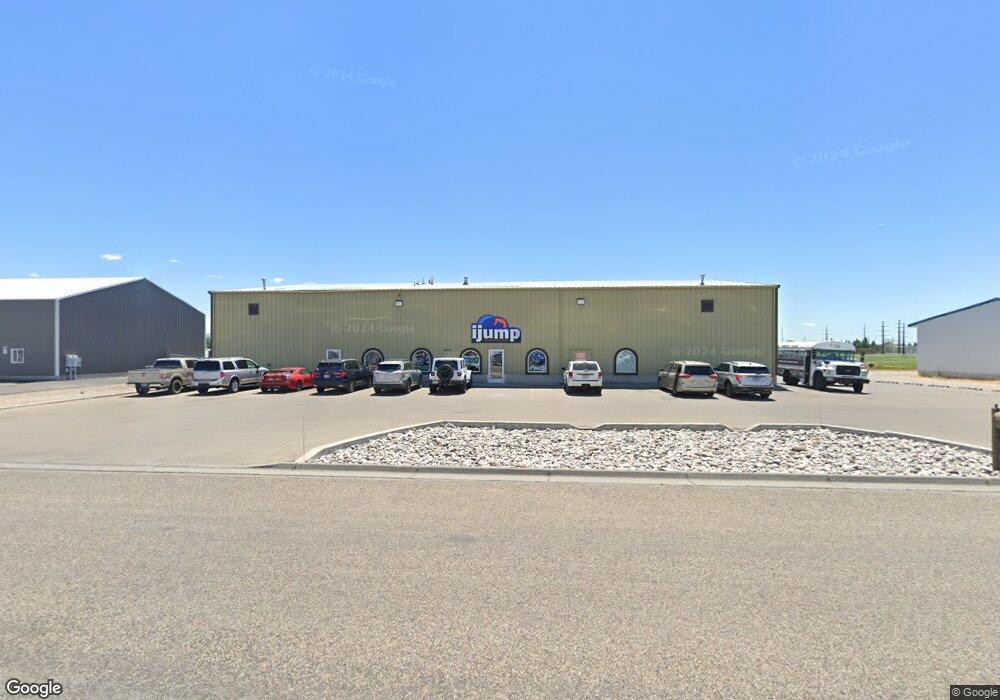
2670 E 14 N Idaho Falls, ID 83401
Estimated Value: $1,038,646
4
Beds
2
Baths
11,000
Sq Ft
$94/Sq Ft
Est. Value
About This Home
This home is located at 2670 E 14 N, Idaho Falls, ID 83401 and is currently estimated at $1,038,646, approximately $94 per square foot. 2670 E 14 N is a home located in Bonneville County with nearby schools including Rocky Mountain Middle School, Summit Hills Elementary School, and Bonneville High School.
Ownership History
Date
Name
Owned For
Owner Type
Purchase Details
Closed on
Dec 18, 2013
Sold by
Millbrook 2 Llc
Bought by
Cc And F Llc
Current Estimated Value
Purchase Details
Closed on
Feb 18, 2013
Sold by
Cutler Josh and Cutler Maralee
Bought by
Millbrook 2 Llc
Purchase Details
Closed on
Jan 17, 2012
Sold by
Kendrick Amy C and Kendrick Brad B
Bought by
Kendrick Brad B
Purchase Details
Closed on
Jan 12, 2012
Sold by
Cutler Maralee and Cutler Josh
Bought by
Cutler Josh
Purchase Details
Closed on
Jan 11, 2012
Sold by
Kendrick Brad B
Bought by
Cutler Josh
Purchase Details
Closed on
Jul 8, 2008
Sold by
Heath Chad and Heath Desiree
Bought by
Kendrick Brad B
Home Financials for this Owner
Home Financials are based on the most recent Mortgage that was taken out on this home.
Original Mortgage
$212,000
Interest Rate
6.04%
Mortgage Type
Commercial
Create a Home Valuation Report for This Property
The Home Valuation Report is an in-depth analysis detailing your home's value as well as a comparison with similar homes in the area
Home Values in the Area
Average Home Value in this Area
Purchase History
| Date | Buyer | Sale Price | Title Company |
|---|---|---|---|
| Cc And F Llc | -- | First American Title | |
| Millbrook 2 Llc | -- | Amerititle | |
| Kendrick Brad B | -- | None Available | |
| Cutler Josh | -- | None Available | |
| Cutler Josh | -- | None Available | |
| Kendrick Brad B | -- | Amerititle |
Source: Public Records
Mortgage History
| Date | Status | Borrower | Loan Amount |
|---|---|---|---|
| Previous Owner | Kendrick Brad B | $212,000 |
Source: Public Records
Tax History Compared to Growth
Tax History
| Year | Tax Paid | Tax Assessment Tax Assessment Total Assessment is a certain percentage of the fair market value that is determined by local assessors to be the total taxable value of land and additions on the property. | Land | Improvement |
|---|---|---|---|---|
| 2025 | $4,049 | $604,670 | $87,120 | $517,550 |
| 2024 | $4,049 | $609,220 | $87,120 | $522,100 |
| 2023 | $3,695 | $424,760 | $87,120 | $337,640 |
| 2022 | $4,076 | $424,760 | $87,120 | $337,640 |
| 2021 | $5,799 | $424,760 | $87,120 | $337,640 |
| 2019 | $6,240 | $424,760 | $87,120 | $337,640 |
| 2018 | $6,389 | $459,399 | $108,900 | $350,499 |
| 2017 | $5,453 | $459,399 | $108,900 | $350,499 |
| 2016 | $5,482 | $391,881 | $41,382 | $350,499 |
| 2015 | $5,354 | $391,904 | $41,382 | $350,522 |
| 2014 | $123,620 | $391,904 | $41,405 | $350,499 |
| 2013 | $5,560 | $427,318 | $41,404 | $385,914 |
Source: Public Records
Map
Nearby Homes
- 1261 Trappers Ridge
- Princeton Plan at Simplicity
- Madison Plan at Simplicity
- Athens Plan at Simplicity
- Magnolia Plan at Simplicity
- Ashland Plan at Simplicity
- Richmond Plan at Simplicity
- Highland Plan at Simplicity
- Fairview Plan at Simplicity
- 3185 E Greenwillow Ln
- 928 N Greenwillow Ln
- 599 Curlew Dr
- 619 N Curlew Dr
- 1760 N Whispering Pines Dr
- 599 N Curlew Dr
- 565 Curlew Dr
- 2343 Mesa St
- 2889 N Curlew Dr
- 538 N Curlew Dr
- 3149 Bergeson Dr
- 2763 E 14th N
- 2667 E 14 N
- 2667 14th N
- 2615 14th N Unit 2
- 2647 E 14 N
- 2647 E 14th N Unit 7
- 2647 E 14th N
- 2905 14th N
- 2903 14th N
- 2621 14th N
- 2621 14th N Unit 3
- 2639 14th N Unit 6
- 2728 14th N Unit 1
- 2728 14th N
- 2728 E 14th N
- 2633 E 14 N
- 2633 14th N
- 2752 E 14th N Unit 1-4
- 2752 E 14th N Unit L
- 2752 E 14th N