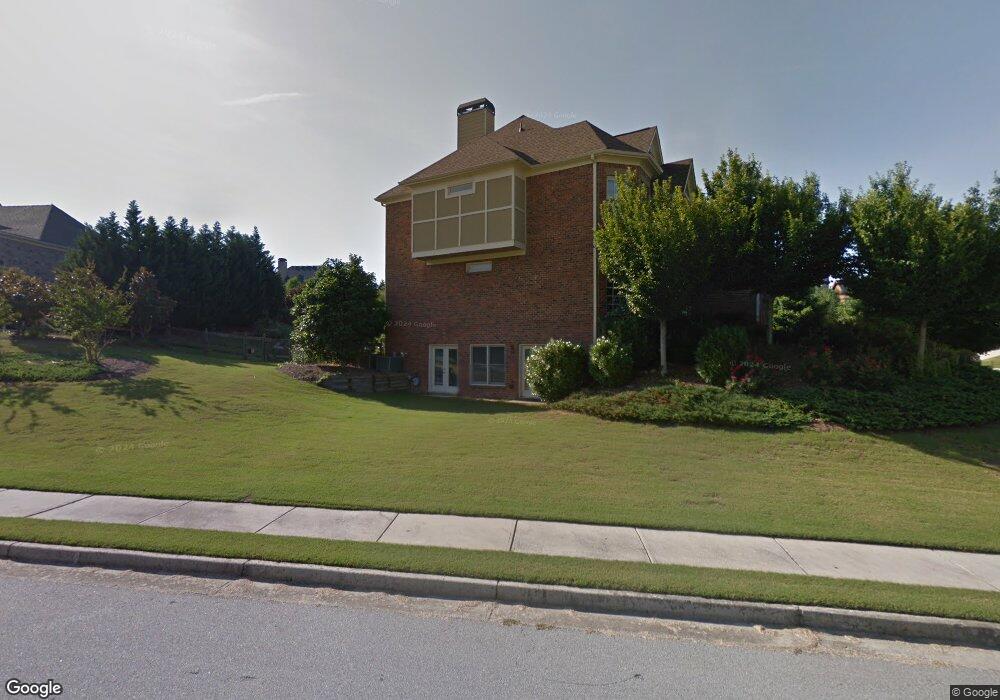
2670 Trailing Ivy Way Buford, GA 30519
Estimated Value: $697,041 - $751,000
5
Beds
4
Baths
3,723
Sq Ft
$196/Sq Ft
Est. Value
About This Home
This home is located at 2670 Trailing Ivy Way, Buford, GA 30519 and is currently estimated at $730,760, approximately $196 per square foot. 2670 Trailing Ivy Way is a home located in Gwinnett County with nearby schools including Patrick Elementary School and Glenn C. Jones Middle School.
Ownership History
Date
Name
Owned For
Owner Type
Purchase Details
Closed on
Feb 10, 2022
Sold by
Raymond Cherice Renee
Bought by
Nguyen Xuandao L
Current Estimated Value
Purchase Details
Closed on
Aug 12, 2021
Sold by
Saeed Shahid
Bought by
Raymond Cherice Renee
Home Financials for this Owner
Home Financials are based on the most recent Mortgage that was taken out on this home.
Original Mortgage
$460,750
Interest Rate
2.8%
Mortgage Type
New Conventional
Purchase Details
Closed on
Aug 25, 2014
Sold by
Wiggle Robert F
Bought by
Saeed Shahid and Shahid Mariyam
Home Financials for this Owner
Home Financials are based on the most recent Mortgage that was taken out on this home.
Original Mortgage
$383,325
Interest Rate
4.2%
Mortgage Type
New Conventional
Create a Home Valuation Report for This Property
The Home Valuation Report is an in-depth analysis detailing your home's value as well as a comparison with similar homes in the area
Home Values in the Area
Average Home Value in this Area
Purchase History
| Date | Buyer | Sale Price | Title Company |
|---|---|---|---|
| Nguyen Xuandao L | $622,000 | -- | |
| Nguyen Xuandao L | -- | -- | |
| Raymond Cherice Renee | $475,000 | -- | |
| Saeed Shahid | $403,500 | -- |
Source: Public Records
Mortgage History
| Date | Status | Borrower | Loan Amount |
|---|---|---|---|
| Previous Owner | Raymond Cherice Renee | $460,750 | |
| Previous Owner | Saeed Shahid | $383,325 |
Source: Public Records
Tax History Compared to Growth
Tax History
| Year | Tax Paid | Tax Assessment Tax Assessment Total Assessment is a certain percentage of the fair market value that is determined by local assessors to be the total taxable value of land and additions on the property. | Land | Improvement |
|---|---|---|---|---|
| 2024 | $9,264 | $248,800 | $56,800 | $192,000 |
| 2023 | $9,264 | $248,800 | $56,800 | $192,000 |
| 2022 | $7,160 | $190,000 | $51,200 | $138,800 |
| 2021 | $6,902 | $179,960 | $41,920 | $138,040 |
| 2020 | $6,549 | $169,080 | $38,000 | $131,080 |
| 2019 | $6,303 | $169,080 | $38,000 | $131,080 |
| 2018 | $6,317 | $169,080 | $38,000 | $131,080 |
| 2016 | $6,015 | $160,080 | $32,000 | $128,080 |
| 2015 | $6,081 | $160,080 | $32,000 | $128,080 |
| 2014 | -- | $160,080 | $32,000 | $128,080 |
Source: Public Records
Map
Nearby Homes
- 2687 Black Fox Ct
- 2581 Trailing Ivy Way
- 3302 Anna Ruby Ln
- 2841 Trailing Ivy Way
- 3045 Camp Branch Rd
- 3123 Walkers Falls Way
- 2381 Walkers Glen Ln Unit 2C
- 2372 Walkers Glen Ln
- 3468 Aberrone Place
- 3379 Camp Branch Rd
- 2760 Camp Branch Rd
- 2856 Habibi Ct
- Hawkins Plan at Towns at Ivy Creek
- Smyrna Plan at Towns at Ivy Creek
- 2395 Kilgore Rd
- 2551 Kilgore Rd
- 2452 Kilgore Rd
- 2550 Kilgore Rd
- 2802 Nettle Ln
- 2670 Trailing Ivy Way
- 2680 Trailing Ivy Way Unit 2
- 2647 Black Fox Ct
- 2670 Trailing Ivy Way NE Unit 63
- 2658 Bridle Ridge Way
- 0 Black Fox Ct Unit 3099142
- 2671 Trailing Ivy Way
- 2657 Black Fox Ct
- 2657 Black Fox Ct Unit 2657
- 2681 Trailing Ivy Way
- 2681 Trailing Ivy Way Unit 15
- 2681 Trailing Ivy Way NE
- 2647 Trailing Ivy Way
- 2661 Trailing Ivy Way
- 2668 Bridle Ridge Way
- 2691 Trailing Ivy Way Unit 2
- 2646 Black Fox Ct
- 2651 Trailing Ivy Way
- 2651 Trailing Ivy Way Unit 18
- 2678 Bridle Ridge Way