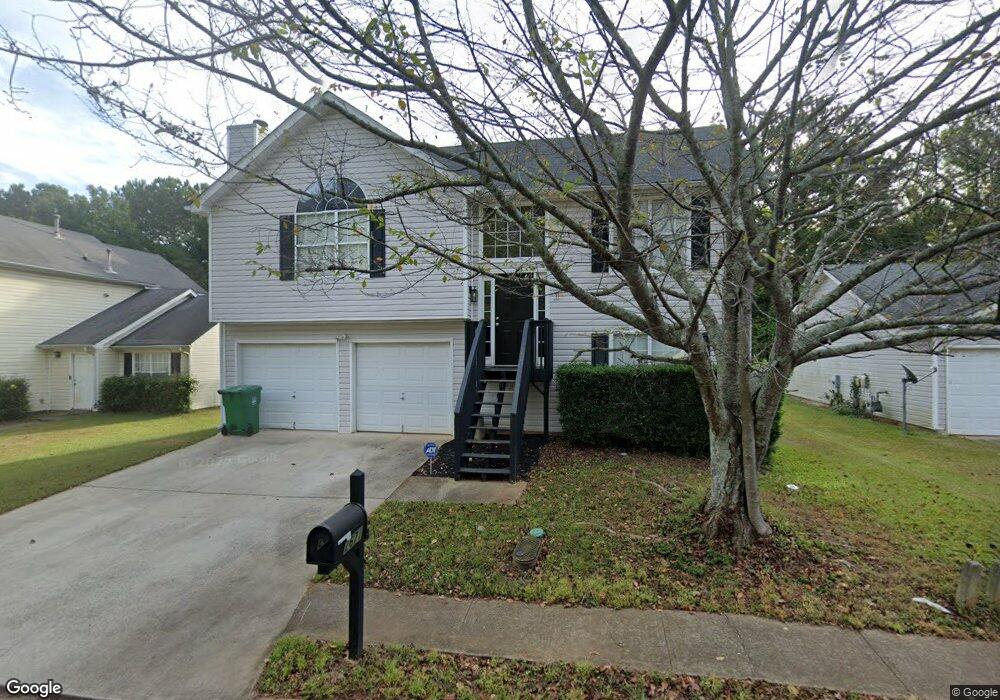
2671 Rambling Way Lithonia, GA 30058
Estimated Value: $233,000 - $257,000
3
Beds
2
Baths
1,560
Sq Ft
$157/Sq Ft
Est. Value
About This Home
This home is located at 2671 Rambling Way, Lithonia, GA 30058 and is currently estimated at $244,482, approximately $156 per square foot. 2671 Rambling Way is a home located in DeKalb County with nearby schools including Stoneview Elementary School, Lithonia Middle School, and Lithonia High School.
Ownership History
Date
Name
Owned For
Owner Type
Purchase Details
Closed on
Jun 28, 2010
Sold by
Kolli Prashanth
Bought by
Wallace Anthony J
Current Estimated Value
Home Financials for this Owner
Home Financials are based on the most recent Mortgage that was taken out on this home.
Original Mortgage
$98,569
Outstanding Balance
$67,344
Interest Rate
5.37%
Mortgage Type
FHA
Estimated Equity
$177,138
Purchase Details
Closed on
Mar 4, 2010
Sold by
Bank Of Ny Trust 2006-Ar8
Bought by
Kolli Prashanth
Purchase Details
Closed on
Nov 3, 2009
Sold by
Scott Darryl T
Bought by
Bank Of Ny Mellon Trust 2006-A
Purchase Details
Closed on
Mar 5, 2001
Sold by
Stonebridge Creek Dev Co Inc
Bought by
Scott Darryl
Home Financials for this Owner
Home Financials are based on the most recent Mortgage that was taken out on this home.
Original Mortgage
$108,058
Interest Rate
7.09%
Mortgage Type
New Conventional
Create a Home Valuation Report for This Property
The Home Valuation Report is an in-depth analysis detailing your home's value as well as a comparison with similar homes in the area
Home Values in the Area
Average Home Value in this Area
Purchase History
| Date | Buyer | Sale Price | Title Company |
|---|---|---|---|
| Wallace Anthony J | $99,900 | -- | |
| Kolli Prashanth | $47,900 | -- | |
| Bank Of Ny Mellon Trust 2006-A | $40,410 | -- | |
| Scott Darryl | $111,400 | -- |
Source: Public Records
Mortgage History
| Date | Status | Borrower | Loan Amount |
|---|---|---|---|
| Open | Wallace Anthony J | $98,569 | |
| Previous Owner | Scott Darryl | $108,058 |
Source: Public Records
Tax History Compared to Growth
Tax History
| Year | Tax Paid | Tax Assessment Tax Assessment Total Assessment is a certain percentage of the fair market value that is determined by local assessors to be the total taxable value of land and additions on the property. | Land | Improvement |
|---|---|---|---|---|
| 2025 | $2,629 | $96,080 | $18,000 | $78,080 |
| 2024 | $2,543 | $90,640 | $18,000 | $72,640 |
| 2023 | $2,543 | $93,960 | $18,000 | $75,960 |
| 2022 | $2,080 | $74,960 | $8,000 | $66,960 |
| 2021 | $1,679 | $56,800 | $8,000 | $48,800 |
| 2020 | $1,541 | $51,280 | $8,000 | $43,280 |
| 2019 | $1,439 | $46,240 | $8,000 | $38,240 |
| 2018 | $1,166 | $47,200 | $8,000 | $39,200 |
| 2017 | $1,428 | $43,880 | $4,200 | $39,680 |
| 2016 | $1,090 | $34,080 | $4,200 | $29,880 |
| 2014 | $853 | $27,120 | $4,200 | $22,920 |
Source: Public Records
Map
Nearby Homes
- 3034 Stonebridge Creek Dr
- 6593 Pole Creek Dr
- 6384 Stonebridge Creek Ln
- 6372 Stonebridge Creek Ln
- 6630 Pole Creek Dr
- 2281 Rambling Way
- 6304 Kendra Ln
- 2116 Charter Ln
- 6420 Marbut Rd
- 2338 Rambling Way
- 2315 Rambling Way
- 2107 Bedford Ct
- 6565 Shaffers Way
- 2520 Rambling Way
- 6470 Bedford Ln
- 6315 Noreen Way
- 6396 Stablewood Way
- 6410 Kennonbriar Ct
- 2665 Rambling Way Unit 1
- 2677 Rambling Way Unit 2
- 3003 Stonebridge Creek Dr Unit 2
- 2997 Stonebridge Creek Dr Unit 2
- 3009 Stonebridge Creek Dr
- 2659 Rambling Way
- 2683 Rambling Way
- 2991 Stonebridge Creek Dr Unit 2
- 2666 Rambling Way
- 2672 Rambling Way
- 2653 Rambling Way
- 2660 Rambling Way Unit 1
- 2689 Rambling Way
- 2678 Rambling Way
- 3021 Stonebridge Creek Dr
- 2985 Stonebridge Creek Dr Unit 2
- 2684 Rambling Way
- 2647 Rambling Way
- 0 Stonebridge Creek Dr Unit 7102290
- 0 Stonebridge Creek Dr Unit 7307131