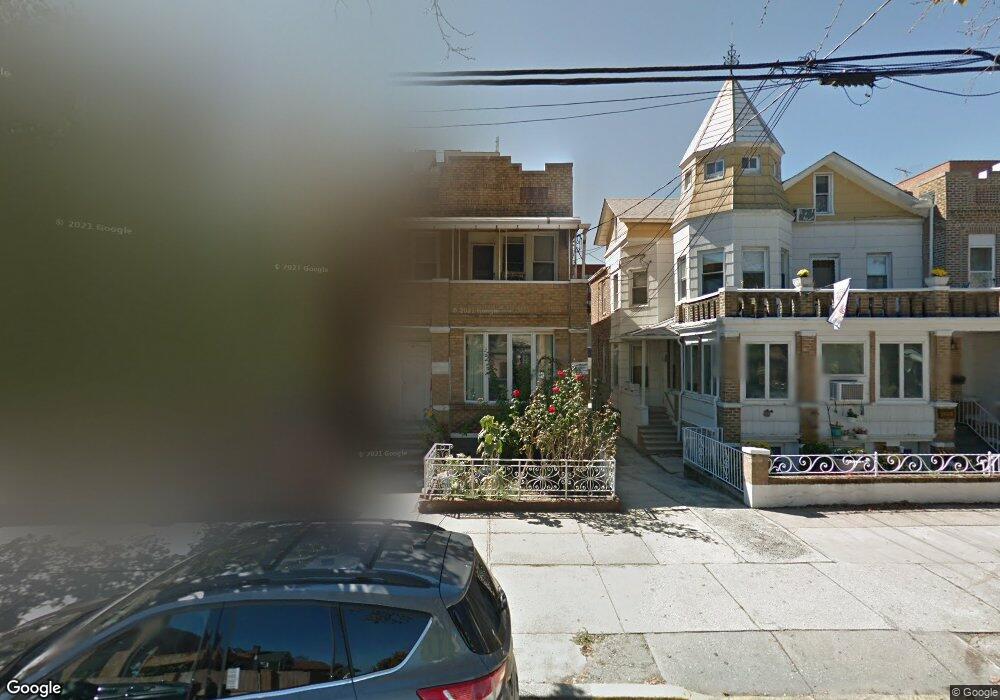
2672 E 21st St Brooklyn, NY 11235
Sheepshead Bay NeighborhoodEstimated Value: $1,282,000 - $1,705,485
Studio
--
Bath
3,230
Sq Ft
$438/Sq Ft
Est. Value
About This Home
This home is located at 2672 E 21st St, Brooklyn, NY 11235 and is currently estimated at $1,414,121, approximately $437 per square foot. 2672 E 21st St is a home located in Kings County with nearby schools including P.S. 254 Dag Hammarskjold, Jhs 14 Shell Bank, and St Mark School.
Ownership History
Date
Name
Owned For
Owner Type
Purchase Details
Closed on
Sep 23, 2014
Sold by
Lao He Hon
Bought by
Xie Shun Dian and Xie Tiffany R
Current Estimated Value
Home Financials for this Owner
Home Financials are based on the most recent Mortgage that was taken out on this home.
Original Mortgage
$534,000
Outstanding Balance
$408,055
Interest Rate
4.09%
Mortgage Type
New Conventional
Estimated Equity
$1,006,066
Purchase Details
Closed on
Jul 31, 2001
Sold by
Lao He Hon
Bought by
Lao He Hon and Luo Mu Chuang
Home Financials for this Owner
Home Financials are based on the most recent Mortgage that was taken out on this home.
Original Mortgage
$250,000
Interest Rate
7.18%
Purchase Details
Closed on
Jun 20, 2001
Sold by
Mendez Isabel
Bought by
Lao He Hon
Home Financials for this Owner
Home Financials are based on the most recent Mortgage that was taken out on this home.
Original Mortgage
$250,000
Interest Rate
7.18%
Create a Home Valuation Report for This Property
The Home Valuation Report is an in-depth analysis detailing your home's value as well as a comparison with similar homes in the area
Home Values in the Area
Average Home Value in this Area
Purchase History
| Date | Buyer | Sale Price | Title Company |
|---|---|---|---|
| Xie Shun Dian | $725,000 | -- | |
| Lao He Hon | -- | -- | |
| Lao He Hon | -- | -- |
Source: Public Records
Mortgage History
| Date | Status | Borrower | Loan Amount |
|---|---|---|---|
| Open | Xie Shun Dian | $534,000 | |
| Previous Owner | Lao He Hon | $250,000 |
Source: Public Records
Tax History
| Year | Tax Paid | Tax Assessment Tax Assessment Total Assessment is a certain percentage of the fair market value that is determined by local assessors to be the total taxable value of land and additions on the property. | Land | Improvement |
|---|---|---|---|---|
| 2025 | $9,069 | $91,560 | $11,580 | $79,980 |
| 2024 | $9,069 | $83,520 | $11,580 | $71,940 |
| 2023 | $8,651 | $102,120 | $11,580 | $90,540 |
| 2022 | $8,504 | $95,760 | $11,580 | $84,180 |
| 2021 | $8,897 | $85,800 | $11,580 | $74,220 |
| 2020 | $4,172 | $78,540 | $11,580 | $66,960 |
| 2019 | $7,871 | $79,380 | $11,580 | $67,800 |
| 2018 | $7,236 | $35,498 | $6,194 | $29,304 |
| 2017 | $7,236 | $35,498 | $7,335 | $28,163 |
| 2016 | $7,043 | $35,230 | $7,605 | $27,625 |
| 2015 | $4,039 | $33,237 | $10,634 | $22,603 |
| 2014 | $4,039 | $31,356 | $10,032 | $21,324 |
Source: Public Records
Map
Nearby Homes
- 3025 Ocean Ave Unit 4D
- 2669 E 22nd St
- 3041 Ocean Ave Unit PH4
- 2308 Jerome Ave
- 2310 Jerome Ave
- 2600 E 21st St Unit 6G
- 2600 E 21st St Unit 7C
- 2600 E 21st St Unit 3K
- 3060 Ocean Ave Unit 3M
- 3060 Ocean Ave Unit 6U
- 3060 Ocean Ave Unit 2L
- 3060 Ocean Ave Unit 4D
- 3060 Ocean Ave Unit 5V
- 2653 E 19th St
- 2721 E 21st St
- 2635 E 19th St
- 1901 Voorhies Ave Unit 2
- 2584 E 21st St
- 2559 E 22nd St
- 2951 Ocean Ave Unit 4D
- 2668 E 21st St
- 2690 E 21st St
- 2666 E 21st St
- 2019 Voorhies Ave
- 2664 E 21st St
- 2023 Voorhies Ave
- 2015 Voorhies Ave
- 2660 E 21st St Unit 2
- 3051 Ocean Ave Unit E 10
- 3051 Ocean Ave Unit E5
- 3051 Ocean Ave
- 3051 Ocean Ave Unit 69
- 3051 Ocean Ave Unit A5
- 3051 Ocean Ave Unit A6
- 3051 Ocean Ave Unit A7
- 2101 Voorhies Ave
- 3043 Ocean Ave
- 2658 E 21st St
- 3041 Ocean Ave Unit 501
- 3041 Ocean Ave Unit 6E
Your Personal Tour Guide
Ask me questions while you tour the home.