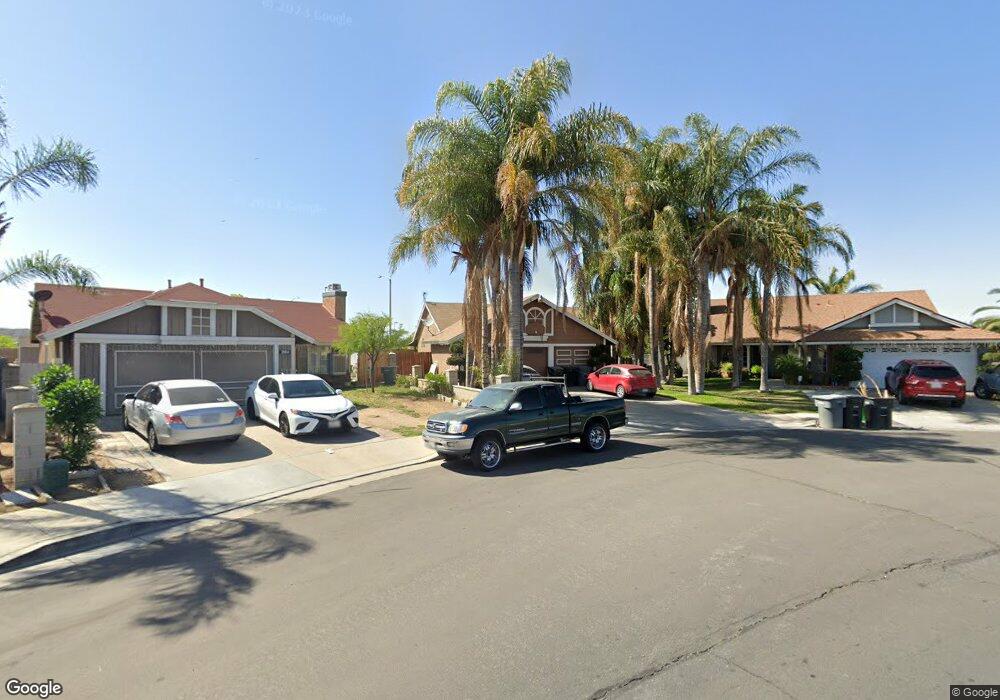
2672 Twenty Grand St Perris, CA 92571
Central Perris NeighborhoodEstimated Value: $477,365 - $502,000
3
Beds
2
Baths
1,371
Sq Ft
$354/Sq Ft
Est. Value
About This Home
This home is located at 2672 Twenty Grand St, Perris, CA 92571 and is currently estimated at $485,841, approximately $354 per square foot. 2672 Twenty Grand St is a home located in Riverside County with nearby schools including Val Verde Elementary School, Lakeside Middle School, and Rancho Verde High School.
Ownership History
Date
Name
Owned For
Owner Type
Purchase Details
Closed on
Mar 20, 2024
Sold by
Orona Saul and Orona Maria
Bought by
Orona Family Trust and Avila
Current Estimated Value
Purchase Details
Closed on
Oct 25, 2002
Sold by
Orona Saul
Bought by
Orona Saul and Orona Maria
Purchase Details
Closed on
Sep 19, 1995
Sold by
Hud
Bought by
Orona Saul
Home Financials for this Owner
Home Financials are based on the most recent Mortgage that was taken out on this home.
Original Mortgage
$78,429
Interest Rate
7.97%
Mortgage Type
FHA
Purchase Details
Closed on
Sep 14, 1995
Sold by
Orona Maria
Bought by
Orona Saul
Home Financials for this Owner
Home Financials are based on the most recent Mortgage that was taken out on this home.
Original Mortgage
$78,429
Interest Rate
7.97%
Mortgage Type
FHA
Purchase Details
Closed on
Nov 30, 1994
Sold by
Commercial Center Bank
Bought by
Hud
Purchase Details
Closed on
Nov 18, 1994
Sold by
Angulo Jose Antonio and Angulo Ana Milagro
Bought by
Commercial Center Bank
Create a Home Valuation Report for This Property
The Home Valuation Report is an in-depth analysis detailing your home's value as well as a comparison with similar homes in the area
Home Values in the Area
Average Home Value in this Area
Purchase History
| Date | Buyer | Sale Price | Title Company |
|---|---|---|---|
| Orona Family Trust | -- | None Listed On Document | |
| Orona Saul | -- | Northern Counties | |
| Orona Saul | $80,000 | United Title | |
| Orona Saul | -- | United Title Company | |
| Hud | -- | Fidelity National Title Ins | |
| Commercial Center Bank | $136,785 | Fidelity National Title Ins |
Source: Public Records
Mortgage History
| Date | Status | Borrower | Loan Amount |
|---|---|---|---|
| Previous Owner | Orona Saul | $78,429 |
Source: Public Records
Tax History Compared to Growth
Tax History
| Year | Tax Paid | Tax Assessment Tax Assessment Total Assessment is a certain percentage of the fair market value that is determined by local assessors to be the total taxable value of land and additions on the property. | Land | Improvement |
|---|---|---|---|---|
| 2025 | $1,622 | $132,858 | $49,818 | $83,040 |
| 2023 | $1,622 | $127,701 | $47,885 | $79,816 |
| 2022 | $1,575 | $125,198 | $46,947 | $78,251 |
| 2021 | $1,564 | $122,744 | $46,027 | $76,717 |
| 2020 | $1,549 | $121,487 | $45,556 | $75,931 |
| 2019 | $1,467 | $119,106 | $44,663 | $74,443 |
| 2018 | $1,447 | $116,772 | $43,788 | $72,984 |
| 2017 | $2,523 | $114,483 | $42,930 | $71,553 |
| 2016 | $2,608 | $112,239 | $42,089 | $70,150 |
| 2015 | $2,590 | $110,555 | $41,457 | $69,098 |
| 2014 | $2,638 | $108,392 | $40,646 | $67,746 |
Source: Public Records
Map
Nearby Homes
- 2490 Cavalcade Ct
- 174 Linden Ct
- 159 Linden Ct
- 2340 Firebrand Ave
- 329 Sparkler Ln
- 410 Water Ave
- 204 Punta Prieta Dr
- 3070 Santo Tomas Ave
- 179 Ensenada Dr
- 3017 Lake View Dr
- 3107 Lake View Dr
- 2245 Liberty Ct
- 2363 Cloverfield St
- 302 Daystar Dr
- 484 Harvest Rd
- 531 Wildwood Ln
- 2138 Star Thistle Ln
- 487 Lassa Way
- 575 Prairie Way
- 0 W Rider St
- 34 Chant St
- 2664 Twenty Grand St
- 2650 N Perris Blvd
- 40 Chant St
- 2656 Twenty Grand St
- 46 Chant St
- 2648 Twenty Grand St
- 2657 Twenty Grand St
- 52 Chant St
- 2640 Twenty Grand St
- 2649 Twenty Grand St
- 2641 Twenty Grand St
- 58 Chant St
- 51 Chant St
- 2634 Twenty Grand St
- 2635 Twenty Grand St
- 57 Chant St
- 66 Chant St
- 2674 N Perris Blvd
- 2622 Larkin Ct