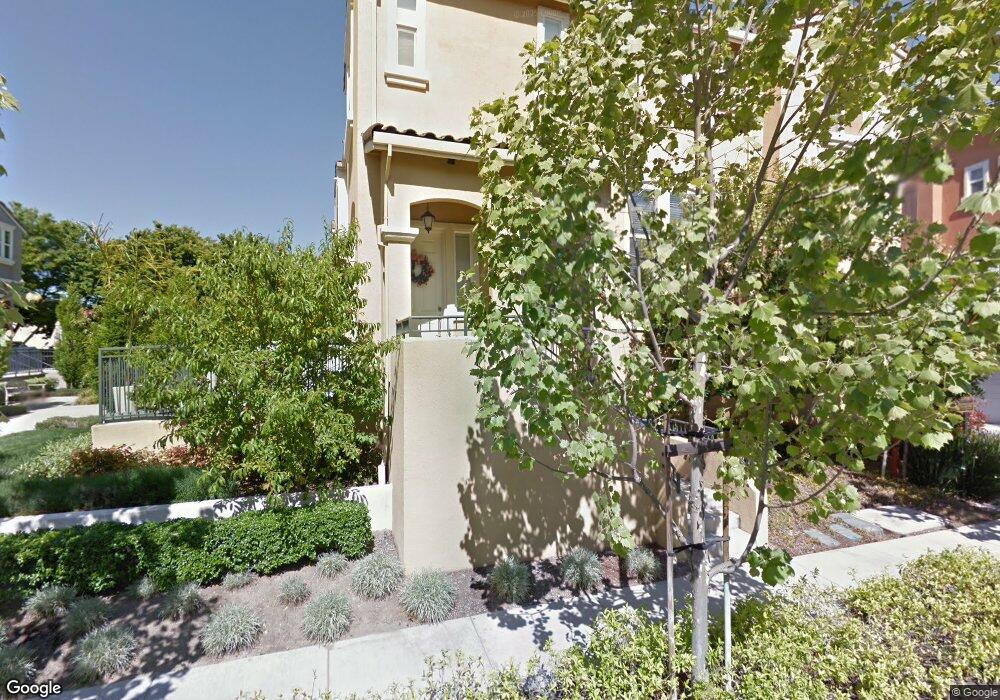
2673 Corde Terra Cir San Jose, CA 95111
Hillsdale NeighborhoodEstimated Value: $1,182,027 - $1,327,000
3
Beds
3
Baths
1,650
Sq Ft
$758/Sq Ft
Est. Value
About This Home
This home is located at 2673 Corde Terra Cir, San Jose, CA 95111 and is currently estimated at $1,250,007, approximately $757 per square foot. 2673 Corde Terra Cir is a home located in Santa Clara County with nearby schools including Franklin Elementary School, Sylvandale Middle School, and Yerba Buena High School.
Ownership History
Date
Name
Owned For
Owner Type
Purchase Details
Closed on
Jan 14, 2009
Sold by
Homesales Inc
Bought by
Garcia Jose G and Garcia Maricel S
Current Estimated Value
Home Financials for this Owner
Home Financials are based on the most recent Mortgage that was taken out on this home.
Original Mortgage
$422,112
Outstanding Balance
$264,809
Interest Rate
5.04%
Mortgage Type
FHA
Estimated Equity
$985,198
Purchase Details
Closed on
May 19, 2008
Sold by
Malouf Issa
Bought by
Homesales Inc
Purchase Details
Closed on
Jun 7, 2006
Sold by
Roem Development Corp
Bought by
Malouf Issa
Home Financials for this Owner
Home Financials are based on the most recent Mortgage that was taken out on this home.
Original Mortgage
$524,700
Interest Rate
6.37%
Mortgage Type
Purchase Money Mortgage
Create a Home Valuation Report for This Property
The Home Valuation Report is an in-depth analysis detailing your home's value as well as a comparison with similar homes in the area
Home Values in the Area
Average Home Value in this Area
Purchase History
| Date | Buyer | Sale Price | Title Company |
|---|---|---|---|
| Garcia Jose G | $430,000 | Chicago Title Company | |
| Homesales Inc | $553,107 | Accommodation | |
| Malouf Issa | $656,000 | Chicago Title Company |
Source: Public Records
Mortgage History
| Date | Status | Borrower | Loan Amount |
|---|---|---|---|
| Open | Garcia Jose G | $422,112 | |
| Previous Owner | Malouf Issa | $131,176 | |
| Previous Owner | Malouf Issa | $524,700 |
Source: Public Records
Tax History Compared to Growth
Tax History
| Year | Tax Paid | Tax Assessment Tax Assessment Total Assessment is a certain percentage of the fair market value that is determined by local assessors to be the total taxable value of land and additions on the property. | Land | Improvement |
|---|---|---|---|---|
| 2025 | $8,462 | $553,596 | $276,798 | $276,798 |
| 2024 | $8,462 | $542,742 | $271,371 | $271,371 |
| 2023 | $8,346 | $532,100 | $266,050 | $266,050 |
| 2022 | $8,164 | $521,668 | $260,834 | $260,834 |
| 2021 | $8,116 | $511,440 | $255,720 | $255,720 |
| 2020 | $7,836 | $506,196 | $253,098 | $253,098 |
| 2019 | $7,516 | $496,272 | $248,136 | $248,136 |
| 2018 | $7,505 | $486,542 | $243,271 | $243,271 |
| 2017 | $7,405 | $477,002 | $238,501 | $238,501 |
| 2016 | $7,041 | $467,650 | $233,825 | $233,825 |
| 2015 | $6,895 | $460,626 | $230,313 | $230,313 |
| 2014 | $6,417 | $451,604 | $225,802 | $225,802 |
Source: Public Records
Map
Nearby Homes
- 2570 Senter Rd
- 478 Sheridan Place
- 2580 Senter Rd Unit 455
- 2580 Senter Rd Unit 515
- 555 Umbarger Rd Unit 131
- 555 Umbarger Rd Unit 43
- 2664 Senter Rd Unit 109
- 2697 Lone Bluff Way
- 2681 Senter Rd
- 608 Balfour Dr
- 2855 Senter Rd Unit 1
- 2855 Senter Rd Unit 30
- 2855 Senter Rd Unit 84
- 2855 Senter Rd Unit 10
- 2855 Senter Rd Unit 95
- 2855 Senter Rd Unit 72
- 2795 Garden Ave
- 653 Dadis Way
- 677 Dadis Way
- 2102 Galveston Ave Unit A
- 2665 Corde Terra Cir
- 2681 Corde Terra Cir
- 2669 Corde Terra Cir
- 2689 Corde Terra Cir
- 2685 Corde Terra Cir
- 2677 Corde Terra Cir
- 2661 Corde Terra Cir
- 531 Mekler Dr
- 2693 Corde Terra Cir
- 537 Mekler Dr
- 528 Conti Ct
- 2715 Corde Terra Cir
- 2649 Corde Terra Cir
- 2641 Corde Terra Cir
- 2657 Corde Terra Cir
- 543 Mekler Dr
- 530 Mekler Dr
- 534 Conti Ct
- 2707 Corde Terra Cir
- 2711 Corde Terra Cir