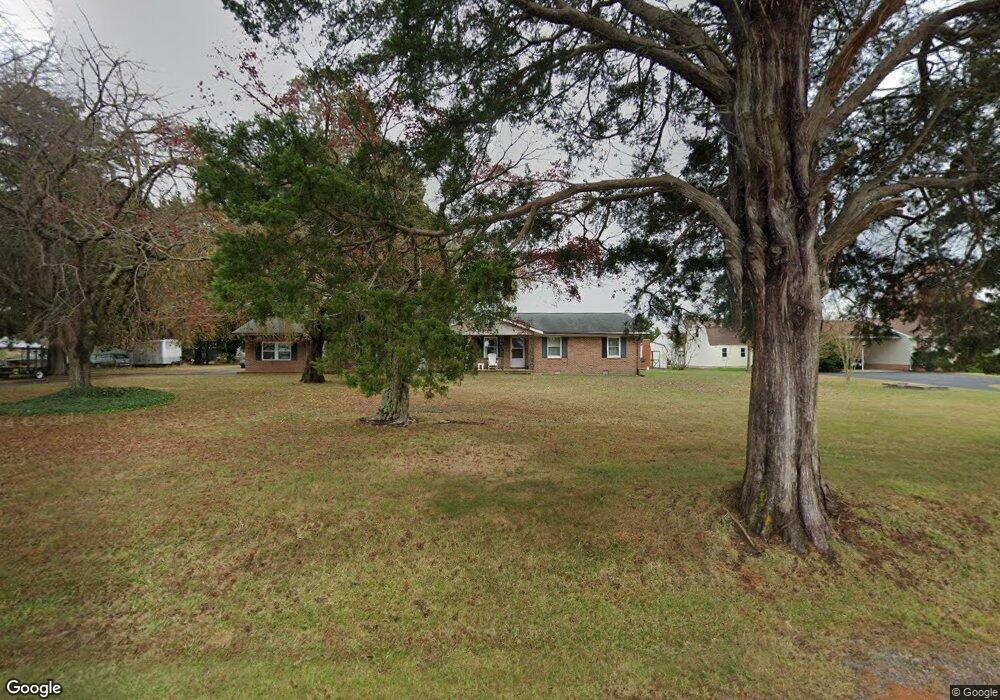
2673 Simonson Rd Farnham, VA 22460
Estimated Value: $500,000 - $622,000
4
Beds
3
Baths
1,708
Sq Ft
$324/Sq Ft
Est. Value
About This Home
This home is located at 2673 Simonson Rd, Farnham, VA 22460 and is currently estimated at $553,377, approximately $323 per square foot. 2673 Simonson Rd is a home located in Richmond County with nearby schools including Richmond County Elementary School and Rappahannock High School.
Ownership History
Date
Name
Owned For
Owner Type
Purchase Details
Closed on
Sep 28, 2009
Sold by
Rivera Anthony
Bought by
Wilkins Jeffrey A
Current Estimated Value
Home Financials for this Owner
Home Financials are based on the most recent Mortgage that was taken out on this home.
Original Mortgage
$320,000
Outstanding Balance
$211,394
Interest Rate
5.31%
Mortgage Type
New Conventional
Estimated Equity
$341,983
Create a Home Valuation Report for This Property
The Home Valuation Report is an in-depth analysis detailing your home's value as well as a comparison with similar homes in the area
Home Values in the Area
Average Home Value in this Area
Purchase History
| Date | Buyer | Sale Price | Title Company |
|---|---|---|---|
| Wilkins Jeffrey A | $400,000 | -- |
Source: Public Records
Mortgage History
| Date | Status | Borrower | Loan Amount |
|---|---|---|---|
| Open | Wilkins Jeffrey A | $320,000 |
Source: Public Records
Tax History Compared to Growth
Tax History
| Year | Tax Paid | Tax Assessment Tax Assessment Total Assessment is a certain percentage of the fair market value that is determined by local assessors to be the total taxable value of land and additions on the property. | Land | Improvement |
|---|---|---|---|---|
| 2024 | $2,507 | $417,819 | $150,905 | $266,914 |
| 2023 | $2,216 | $316,581 | $150,696 | $165,885 |
| 2022 | $2,216 | $316,581 | $150,696 | $165,885 |
| 2021 | $2,216 | $316,581 | $150,696 | $165,885 |
| 2020 | $2,216 | $316,581 | $150,696 | $165,885 |
| 2019 | $2,295 | $327,881 | $150,696 | $177,185 |
| 2018 | $2,295 | $327,881 | $150,696 | $177,185 |
| 2017 | $2,295 | $327,881 | $150,696 | $177,185 |
| 2016 | $2,295 | $327,881 | $0 | $0 |
| 2015 | $2,197 | $0 | $0 | $0 |
| 2014 | $2,197 | $0 | $0 | $0 |
| 2013 | $2,197 | $0 | $0 | $0 |
Source: Public Records
Map
Nearby Homes
- 368 Hale Dr
- 529 Morattico Creek Rd
- 435 Morattico Creek Rd
- 68 Flagstaff Rd
- Tbd Norwood Church Rd Lot Unit WP001
- Lot 5 Deer Trail Dr
- Lot 3 Deer Trail Dr
- Lot 4 Deer Trail Dr
- 0 Norwood Church Rd
- 00 Norwood Church Rd
- 562 Riverside Dr
- 564 Riverside Dr
- 5367 Morattico Rd
- 470 Mulberry Creek Rd
- 10-12 Lancaster Creek Rd
- Lots 10, 11, 12 Lancaster Creek Rd
- 5-47 Shore Dr
- 4 Paddock Dr
- 675 Hard Bargain Ln
- Pcl 83 Woodberry Ln
- 2703 Simonson Rd
- 2641 Simonson Rd
- 2723 Simonson Rd
- 2609 Simonson Rd
- 2741 Simonson Rd
- 2759 Simonson Rd
- 2589 Simonson Rd
- 2803 Simonson Rd
- 2559 Simonson Rd
- 2535 Simonson Rd
- 2494 Simonson Rd
- 2883 Simonson Rd
- 2477 Simonson Rd
- 1820 Simonson Rd
- 2986 Simonson Rd
- 3050 Simonson Rd
- 3043 Simonson Rd
- 3002 Simonson Rd
- 2924B Simonson Rd
- 2924 Simonson Rd