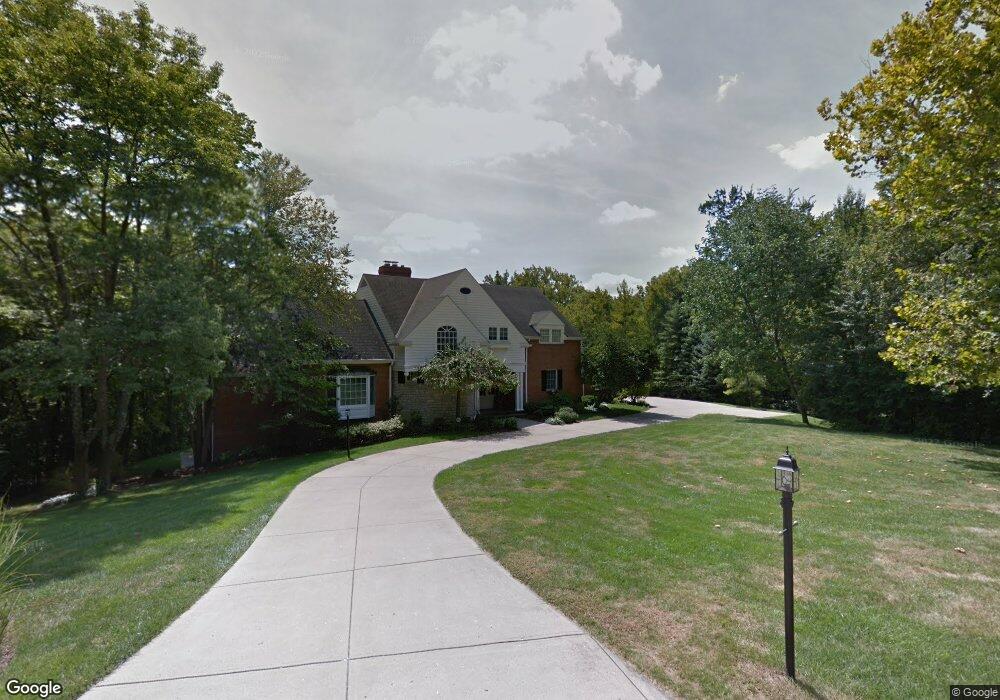
2674 Devils Backbone Rd Cincinnati, OH 45233
Estimated Value: $1,068,000 - $1,184,000
4
Beds
6
Baths
4,874
Sq Ft
$229/Sq Ft
Est. Value
About This Home
This home is located at 2674 Devils Backbone Rd, Cincinnati, OH 45233 and is currently estimated at $1,118,234, approximately $229 per square foot. 2674 Devils Backbone Rd is a home located in Hamilton County with nearby schools including John Foster Dulles Elementary School, Rapid Run Middle School, and Oak Hills High School.
Ownership History
Date
Name
Owned For
Owner Type
Purchase Details
Closed on
Jan 6, 2020
Sold by
Walter Andrew J and Walter Laurie Ann
Bought by
Walter Andrew J and Walter Laurie Ann
Current Estimated Value
Purchase Details
Closed on
Jun 1, 2010
Sold by
Hendy Daniel M and Hendy Teresa B
Bought by
Walter Andrew J and Walter Deborah S
Home Financials for this Owner
Home Financials are based on the most recent Mortgage that was taken out on this home.
Original Mortgage
$491,250
Outstanding Balance
$326,747
Interest Rate
5.13%
Mortgage Type
New Conventional
Estimated Equity
$791,487
Purchase Details
Closed on
Oct 16, 2006
Sold by
Jupiter Works Llc
Bought by
Hendy Daniel and Hendy Teresa
Home Financials for this Owner
Home Financials are based on the most recent Mortgage that was taken out on this home.
Original Mortgage
$589,000
Interest Rate
5.87%
Mortgage Type
Unknown
Create a Home Valuation Report for This Property
The Home Valuation Report is an in-depth analysis detailing your home's value as well as a comparison with similar homes in the area
Home Values in the Area
Average Home Value in this Area
Purchase History
| Date | Buyer | Sale Price | Title Company |
|---|---|---|---|
| Walter Andrew J | -- | None Available | |
| Walter Andrew J | $655,000 | Attorney | |
| Hendy Daniel | $389,000 | Attorney |
Source: Public Records
Mortgage History
| Date | Status | Borrower | Loan Amount |
|---|---|---|---|
| Open | Walter Andrew J | $491,250 | |
| Previous Owner | Hendy Daniel | $589,000 |
Source: Public Records
Tax History
| Year | Tax Paid | Tax Assessment Tax Assessment Total Assessment is a certain percentage of the fair market value that is determined by local assessors to be the total taxable value of land and additions on the property. | Land | Improvement |
|---|---|---|---|---|
| 2025 | $17,697 | $339,900 | $46,379 | $293,521 |
| 2023 | $17,287 | $339,900 | $46,379 | $293,521 |
| 2022 | $14,734 | $245,578 | $43,274 | $202,304 |
| 2021 | $13,256 | $236,271 | $43,274 | $192,997 |
| 2020 | $12,891 | $236,271 | $43,274 | $192,997 |
| 2019 | $12,626 | $210,956 | $38,637 | $172,319 |
| 2018 | $12,644 | $210,956 | $38,637 | $172,319 |
| 2017 | $11,932 | $210,956 | $38,637 | $172,319 |
| 2016 | $13,249 | $233,835 | $38,220 | $195,615 |
| 2015 | $13,346 | $233,835 | $38,220 | $195,615 |
| 2014 | $13,362 | $233,835 | $38,220 | $195,615 |
| 2013 | $12,241 | $229,250 | $37,471 | $191,779 |
Source: Public Records
Map
Nearby Homes
- 2659 Devils Backbone Rd
- 2417 Quail Run Farm Ln
- 2239 Quail Run Farm Ln
- 6944 Old Stone Ridge
- 6090 Muddy Creek Rd
- 6040 Countrymeadow Ln
- 6233 Sharlene Dr
- 1711 Ebenezer Rd
- 1659 Devils Backbone Rd
- 1287 Heather Ridge
- 1259 Wexford Ln
- 5961 Lawrence Rd
- 7284 Kirkridge Dr
- 5918 Leeside Trail
- 3433 Tolland Ct
- 3388 Markdale Ct
- 3311 Starhaven Trail
- 6684 Powner Farm Dr
- 5869 Weston Ct
- 3454 Eyrich Rd
- 2676 Devils Backbone Rd
- 2678 Devils Backbone Rd
- 2630 Devils Backbone Rd
- 2570 Devils Backbone Rd
- 2550 Devils Backbone Rd
- 2652 Devils Backbone Rd
- 2664 Devils Backbone Rd
- 2692 Devils Backbone Rd
- 2530 Devils Backbone Rd
- 2668 Devils Backbone Rd
- 2450 Devils Backbone Rd
- 2510 Devils Backbone Rd
- 2452 Devils Backbone Rd
- 2617 Devils Backbone Rd
- 2591 Devils Backbone Rd
- 2565 Devils Backbone Rd
- 2466 Devils Backbone Rd
- 2498 Devils Backbone Rd
- 2551 Devils Backbone Rd
- 2671 Devils Backbone Rd
Your Personal Tour Guide
Ask me questions while you tour the home.