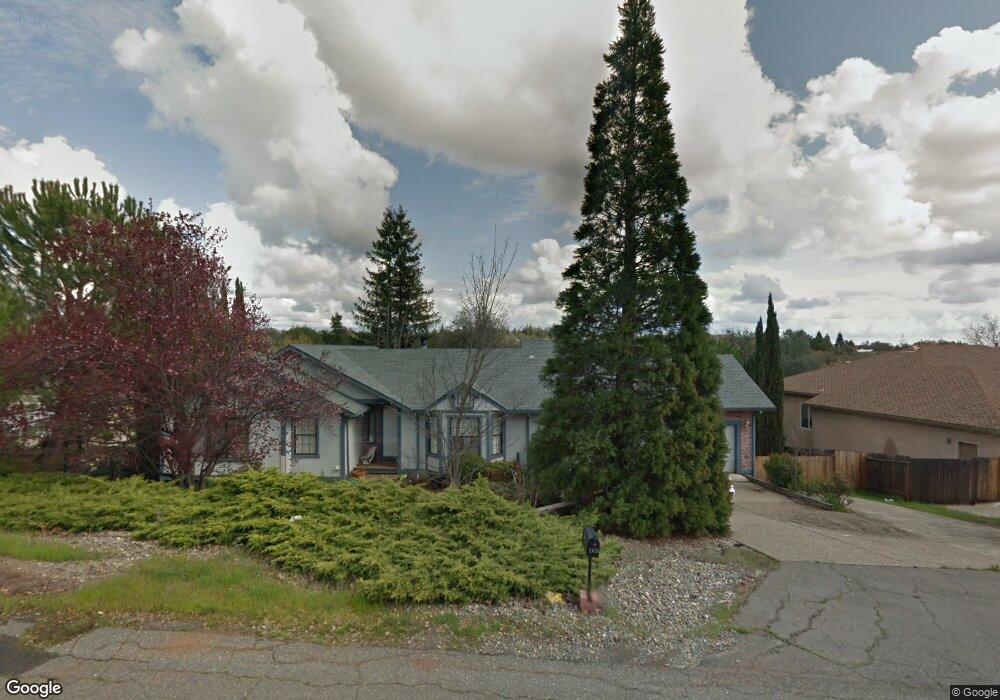
2674 Green Glen Rd Cameron Park, CA 95682
Estimated Value: $467,000 - $659,332
3
Beds
2
Baths
1,916
Sq Ft
$313/Sq Ft
Est. Value
About This Home
This home is located at 2674 Green Glen Rd, Cameron Park, CA 95682 and is currently estimated at $600,333, approximately $313 per square foot. 2674 Green Glen Rd is a home located in El Dorado County with nearby schools including Camerado Springs Middle School, Ponderosa High School, and Buckeye Union Mandarin Immersion Charter School.
Ownership History
Date
Name
Owned For
Owner Type
Purchase Details
Closed on
Aug 28, 2023
Sold by
Preston Family Trust
Bought by
Preston David
Current Estimated Value
Purchase Details
Closed on
Jun 3, 2019
Sold by
Preston John and Preston Bonnie
Bought by
Preston John and Preston Bonnie
Purchase Details
Closed on
Jul 3, 2008
Sold by
Huynh My B and Pham Truong H
Bought by
Preston John and Preston Bonnie
Purchase Details
Closed on
Nov 16, 2004
Sold by
Simpson Terue
Bought by
Pham Truong H and Huynh My B
Home Financials for this Owner
Home Financials are based on the most recent Mortgage that was taken out on this home.
Original Mortgage
$328,000
Interest Rate
5.72%
Mortgage Type
Purchase Money Mortgage
Purchase Details
Closed on
Jun 29, 1994
Sold by
Wheeler Lester W and Wheeler Janet L
Bought by
Simpson George and Simpson Terue
Create a Home Valuation Report for This Property
The Home Valuation Report is an in-depth analysis detailing your home's value as well as a comparison with similar homes in the area
Home Values in the Area
Average Home Value in this Area
Purchase History
| Date | Buyer | Sale Price | Title Company |
|---|---|---|---|
| Preston David | -- | None Listed On Document | |
| Preston John | -- | None Available | |
| Preston John | $355,000 | Placer Title Company | |
| Pham Truong H | $410,000 | Alliance Title Company | |
| Simpson George | $167,500 | Placer Title Company |
Source: Public Records
Mortgage History
| Date | Status | Borrower | Loan Amount |
|---|---|---|---|
| Previous Owner | Pham Truong H | $328,000 | |
| Closed | Pham Truong H | $41,000 |
Source: Public Records
Tax History Compared to Growth
Tax History
| Year | Tax Paid | Tax Assessment Tax Assessment Total Assessment is a certain percentage of the fair market value that is determined by local assessors to be the total taxable value of land and additions on the property. | Land | Improvement |
|---|---|---|---|---|
| 2025 | $6,051 | $576,300 | $168,300 | $408,000 |
| 2024 | $6,051 | $565,000 | $165,000 | $400,000 |
| 2023 | $4,773 | $439,386 | $99,011 | $340,375 |
| 2022 | $4,704 | $430,771 | $97,070 | $333,701 |
| 2021 | $4,645 | $422,325 | $95,167 | $327,158 |
| 2020 | $4,583 | $417,996 | $94,192 | $323,804 |
| 2019 | $4,507 | $409,801 | $92,346 | $317,455 |
| 2018 | $4,390 | $401,767 | $90,536 | $311,231 |
| 2017 | $4,302 | $393,890 | $88,761 | $305,129 |
| 2016 | $4,250 | $386,168 | $87,021 | $299,147 |
| 2015 | $4,188 | $380,369 | $85,715 | $294,654 |
| 2014 | $3,547 | $319,500 | $72,000 | $247,500 |
Source: Public Records
Map
Nearby Homes
- 3590 Montclair Rd
- 2830 Osborne Rd
- 3545 Montclair Rd
- 3677 Millbrae Rd
- 2896 Knollwood Dr
- 2886 Knollwood Dr
- 3400 Woodleigh Ln
- 3076 Royal Dr
- 3041 Merrywood Cir
- 3038 Merrywood Cir
- 3881 Rustic Rd
- 3002 Tri Ln
- 3144 Quad Ln Unit F
- 3222 Heights Dr
- 3379 Cambridge Rd
- 3508 Fairway Dr
- 3264 Heights Dr
- 3098 Oakwood Rd
- 3831 Sheridan Rd
- 3505 Fairway Dr
- 2666 Green Glen Rd
- 2684 Green Glen Rd
- 2656 Green Glen Rd
- 3630 Cambridge Rd
- 3622 Cambridge Rd
- 2694 Green Glen Rd
- 2675 Green Glen Rd
- 2681 Green Glen Rd
- 3638 Cambridge Rd
- 2667 Green Glen Rd
- 3614 Cambridge Rd
- 2689 Green Glen Rd
- 2650 Green Glen Rd
- 3648 Cambridge Rd
- 3581 Green Glen Ct
- 3606 Cambridge Rd
- 2706 Green Glen Rd
- 2695 Green Glen Rd
- 3012 Knollwood Dr
- 3577 Green Glen Ct