26745 Grayslake Rd Rancho Palos Verdes, CA 90275
Estimated Value: $1,564,000 - $1,712,000
3
Beds
2
Baths
1,472
Sq Ft
$1,112/Sq Ft
Est. Value
About This Home
This home is located at 26745 Grayslake Rd, Rancho Palos Verdes, CA 90275 and is currently estimated at $1,636,721, approximately $1,111 per square foot. 26745 Grayslake Rd is a home located in Los Angeles County with nearby schools including Montemalaga Elementary School, Palos Verdes Intermediate School, and Palos Verdes Peninsula High School.
Ownership History
Date
Name
Owned For
Owner Type
Purchase Details
Closed on
Sep 28, 2015
Sold by
Falter Mark A and Falter Cynthia B
Bought by
The Mark & Cynthia Falter 2015 Trust
Current Estimated Value
Purchase Details
Closed on
Oct 1, 2002
Sold by
Falter Mark A
Bought by
Falter Mark A and Falter Cynthia
Home Financials for this Owner
Home Financials are based on the most recent Mortgage that was taken out on this home.
Original Mortgage
$243,330
Interest Rate
6.17%
Purchase Details
Closed on
May 5, 1999
Sold by
Kugies Manfred H and Kugies Ursula
Bought by
Falter Mark A
Home Financials for this Owner
Home Financials are based on the most recent Mortgage that was taken out on this home.
Original Mortgage
$350,000
Interest Rate
7.01%
Create a Home Valuation Report for This Property
The Home Valuation Report is an in-depth analysis detailing your home's value as well as a comparison with similar homes in the area
Home Values in the Area
Average Home Value in this Area
Purchase History
| Date | Buyer | Sale Price | Title Company |
|---|---|---|---|
| The Mark & Cynthia Falter 2015 Trust | -- | None Available | |
| Falter Mark A | -- | American Coast Title | |
| Falter Mark A | $450,000 | Fidelity National Title Co |
Source: Public Records
Mortgage History
| Date | Status | Borrower | Loan Amount |
|---|---|---|---|
| Closed | Falter Mark A | $243,330 | |
| Closed | Falter Mark A | $350,000 |
Source: Public Records
Tax History Compared to Growth
Tax History
| Year | Tax Paid | Tax Assessment Tax Assessment Total Assessment is a certain percentage of the fair market value that is determined by local assessors to be the total taxable value of land and additions on the property. | Land | Improvement |
|---|---|---|---|---|
| 2025 | $8,766 | $730,905 | $564,369 | $166,536 |
| 2024 | $8,766 | $716,574 | $553,303 | $163,271 |
| 2023 | $8,544 | $702,524 | $542,454 | $160,070 |
| 2022 | $8,124 | $688,750 | $531,818 | $156,932 |
| 2021 | $8,119 | $675,246 | $521,391 | $153,855 |
| 2019 | $7,771 | $655,220 | $505,927 | $149,293 |
| 2018 | $7,622 | $642,373 | $496,007 | $146,366 |
| 2016 | $7,293 | $617,432 | $476,748 | $140,684 |
| 2015 | $7,307 | $608,158 | $469,587 | $138,571 |
| 2014 | $7,215 | $596,246 | $460,389 | $135,857 |
Source: Public Records
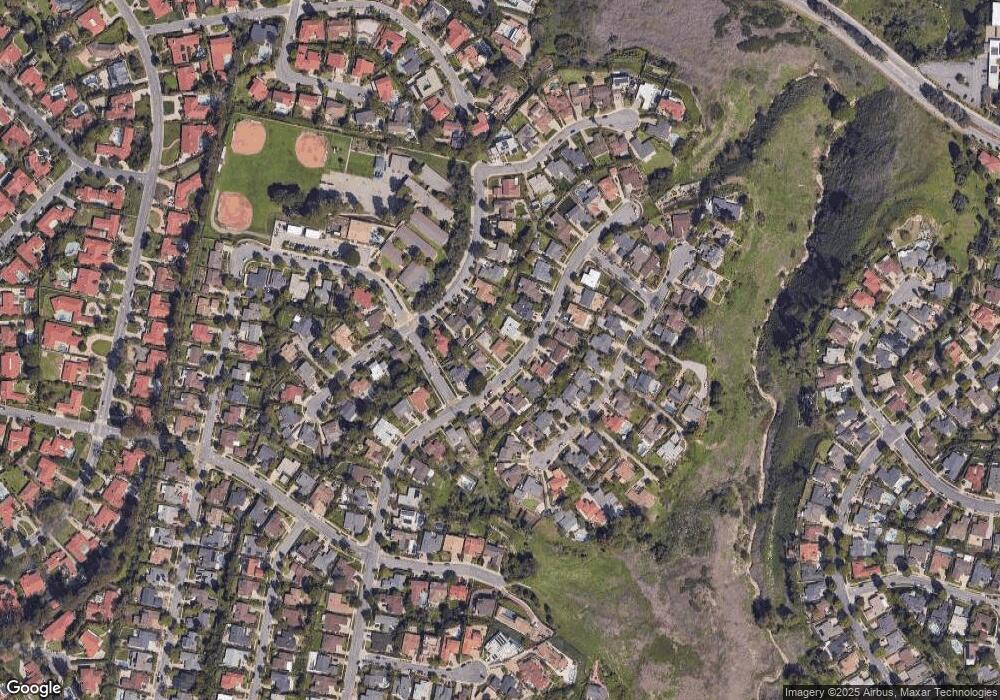
Map
Nearby Homes
- 6039 Via Sonoma
- 1300 Granvia Altamira
- 2457 Via Sonoma
- 2521 Novato Place
- 1133 Granvia Altamira
- 1325 Via Gabriel
- 5508 Ironwood St
- 27032 Freeport Rd
- 2229 Via Cerritos
- 27056 Shorewood Rd
- 58 Hilltop Cir
- 5718 Ravenspur Dr Unit 307
- 702 Via la Cuesta
- 5700 Ravenspur Dr Unit 107
- 26326 Birchfield Ave
- 28005 Ridgebluff Ct
- 5644 Ravenspur Dr
- 15 Hilltop Cir
- 28012 Ridgeforest Ct
- 6307 Ridgeglade Ct
- 26735 Grayslake Rd
- 26742 Hyte Rd
- 26748 Hyte Rd
- 26727 Grayslake Rd
- 6005 Groveoak Place
- 26736 Hyte Rd
- 26754 Hyte Rd
- 26744 Grayslake Rd
- 26738 Grayslake Rd
- 26752 Grayslake Rd
- 26732 Grayslake Rd
- 26717 Grayslake Rd
- 26758 Grayslake Rd
- 26728 Hyte Rd
- 26726 Grayslake Rd
- 26766 Grayslake Rd
- 26807 Grayslake Rd
- 26711 Grayslake Rd
- 26720 Grayslake Rd
- 26751 Menominee Place