Estimated Value: $381,509 - $440,000
4
Beds
3
Baths
2,338
Sq Ft
$174/Sq Ft
Est. Value
About This Home
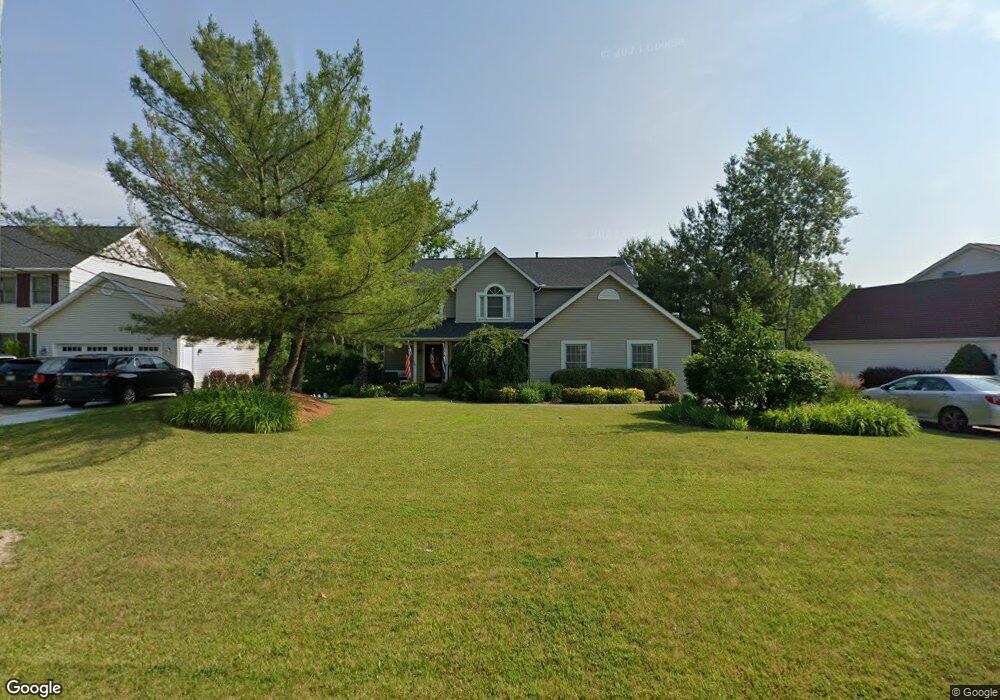
This home is located at 2675 Norton Rd, Stow, OH 44224 and is currently estimated at $407,877, approximately $174 per square foot. 2675 Norton Rd is a home located in Summit County with nearby schools including Stow-Munroe Falls High School, Primrose School of Hudson, and Seton Catholic Elementary School.
Ownership History
Date
Name
Owned For
Owner Type
Purchase Details
Closed on
Sep 20, 2001
Sold by
Wedo Jason T
Bought by
Wedo Jason T and Wedo Jennifer L
Current Estimated Value
Home Financials for this Owner
Home Financials are based on the most recent Mortgage that was taken out on this home.
Original Mortgage
$220,000
Outstanding Balance
$85,663
Interest Rate
6.97%
Estimated Equity
$322,214
Purchase Details
Closed on
Jun 16, 2000
Sold by
Kuchar Edward R
Bought by
Wedo Jason T
Home Financials for this Owner
Home Financials are based on the most recent Mortgage that was taken out on this home.
Original Mortgage
$199,900
Interest Rate
8.56%
Purchase Details
Closed on
Mar 29, 1996
Sold by
Clouse Phillip G
Bought by
Kuchar Edward R
Home Financials for this Owner
Home Financials are based on the most recent Mortgage that was taken out on this home.
Original Mortgage
$109,000
Interest Rate
6.98%
Mortgage Type
New Conventional
Create a Home Valuation Report for This Property
The Home Valuation Report is an in-depth analysis detailing your home's value as well as a comparison with similar homes in the area
Home Values in the Area
Average Home Value in this Area
Purchase History
| Date | Buyer | Sale Price | Title Company |
|---|---|---|---|
| Wedo Jason T | -- | Safeguard Title Agency | |
| Wedo Jason T | $249,900 | Affiliated Title | |
| Kuchar Edward R | $185,500 | -- |
Source: Public Records
Mortgage History
| Date | Status | Borrower | Loan Amount |
|---|---|---|---|
| Open | Wedo Jason T | $220,000 | |
| Closed | Wedo Jason T | $199,900 | |
| Previous Owner | Kuchar Edward R | $109,000 |
Source: Public Records
Tax History Compared to Growth
Tax History
| Year | Tax Paid | Tax Assessment Tax Assessment Total Assessment is a certain percentage of the fair market value that is determined by local assessors to be the total taxable value of land and additions on the property. | Land | Improvement |
|---|---|---|---|---|
| 2025 | $5,729 | $101,784 | $16,982 | $84,802 |
| 2024 | $5,729 | $101,784 | $16,982 | $84,802 |
| 2023 | $5,729 | $101,784 | $16,982 | $84,802 |
| 2022 | $5,042 | $79,041 | $13,164 | $65,877 |
| 2021 | $4,514 | $79,041 | $13,164 | $65,877 |
| 2020 | $4,436 | $79,040 | $13,160 | $65,880 |
| 2019 | $4,523 | $75,390 | $17,630 | $57,760 |
| 2018 | $4,449 | $75,390 | $17,630 | $57,760 |
| 2017 | $4,575 | $75,390 | $17,630 | $57,760 |
| 2016 | $4,709 | $75,390 | $17,630 | $57,760 |
| 2015 | $4,575 | $75,390 | $17,630 | $57,760 |
| 2014 | $4,579 | $75,390 | $17,630 | $57,760 |
| 2013 | $4,814 | $79,830 | $17,630 | $62,200 |
Source: Public Records
Map
Nearby Homes
- 5431 Diana Lynn Dr
- 2749 Norton Rd
- 5473 Young Rd
- 5465 Park Vista Ct
- 5241 Brockton Dr
- 4901 Pebblehurst Dr
- 4917 Independence Cir Unit B
- V/L Norton Rd
- 4901 Independence Cir Unit B
- 2327 Crockett Cir
- 2444 Port Charles Dr
- 3165 Peterboro Dr
- 2380 Port Williams Dr Unit 2380
- 4621 Graford Ln
- 1884 Village Ct Unit X66
- 4731 Haughton Ct
- 0 Stow Rd Unit 5102979
- 5139 Rockport Cove
- 1759 E Sapphire Dr
- 2418 Wrens Dr S Unit G
- 2669 Norton Rd
- 2681 Norton Rd
- 2661 Norton Rd
- 2666 Norton Rd
- 2659 Norton Rd
- 2660 Norton Rd
- 2711 Norton Rd
- 2652 Norton Rd
- 5437 Diana Lynn Dr
- 5425 Diana Lynn Dr
- 5445 Diana Lynn Dr
- 2642 Norton Rd
- 2635 Norton Rd
- 2940 Ravineview Cir
- 5419 Diana Lynn Dr
- 2735 Norton Rd
- 5497 Celeste View Dr
- 2950 Ravineview Cir
- 2931 Ravineview Cir
- 5430 Diana Lynn Dr