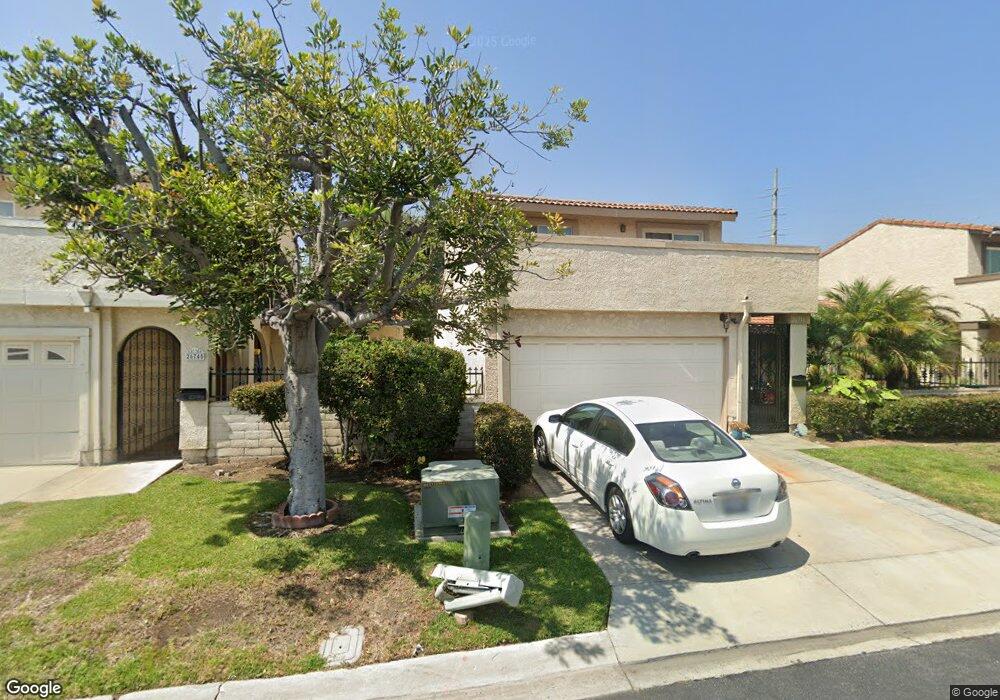
26751 Via el Socorro San Juan Capistrano, CA 92675
Estimated Value: $825,807 - $967,000
2
Beds
2
Baths
1,451
Sq Ft
$632/Sq Ft
Est. Value
About This Home
This home is located at 26751 Via el Socorro, San Juan Capistrano, CA 92675 and is currently estimated at $916,702, approximately $631 per square foot. 26751 Via el Socorro is a home located in Orange County with nearby schools including San Juan Elementary School, Marco Forster Middle School, and San Juan Hills High School.
Ownership History
Date
Name
Owned For
Owner Type
Purchase Details
Closed on
Dec 16, 1998
Sold by
David Casteel
Bought by
Jimenez Jose A and Jimenez Divina G
Current Estimated Value
Home Financials for this Owner
Home Financials are based on the most recent Mortgage that was taken out on this home.
Original Mortgage
$154,400
Interest Rate
8.12%
Purchase Details
Closed on
Jan 6, 1995
Sold by
Casteel Nina
Bought by
Casteel David
Home Financials for this Owner
Home Financials are based on the most recent Mortgage that was taken out on this home.
Original Mortgage
$75,000
Interest Rate
9.29%
Purchase Details
Closed on
Oct 19, 1994
Sold by
Casteel David and Babbini Margaret R
Bought by
Casteel David
Create a Home Valuation Report for This Property
The Home Valuation Report is an in-depth analysis detailing your home's value as well as a comparison with similar homes in the area
Home Values in the Area
Average Home Value in this Area
Purchase History
| Date | Buyer | Sale Price | Title Company |
|---|---|---|---|
| Jimenez Jose A | $193,500 | Benefit Land Title Company | |
| Casteel David | -- | Fidelity National Title | |
| Casteel David | -- | -- |
Source: Public Records
Mortgage History
| Date | Status | Borrower | Loan Amount |
|---|---|---|---|
| Previous Owner | Jimenez Jose A | $154,400 | |
| Previous Owner | Casteel David | $75,000 | |
| Closed | Jimenez Jose A | $28,950 |
Source: Public Records
Tax History Compared to Growth
Tax History
| Year | Tax Paid | Tax Assessment Tax Assessment Total Assessment is a certain percentage of the fair market value that is determined by local assessors to be the total taxable value of land and additions on the property. | Land | Improvement |
|---|---|---|---|---|
| 2025 | $3,352 | $303,339 | $188,018 | $115,321 |
| 2024 | $3,352 | $297,392 | $184,332 | $113,060 |
| 2023 | $3,222 | $291,561 | $180,717 | $110,844 |
| 2022 | $2,891 | $285,845 | $177,174 | $108,671 |
| 2021 | $2,836 | $280,241 | $173,700 | $106,541 |
| 2020 | $2,811 | $277,368 | $171,919 | $105,449 |
| 2019 | $2,758 | $271,930 | $168,548 | $103,382 |
| 2018 | $2,707 | $266,599 | $165,244 | $101,355 |
| 2017 | $2,680 | $261,372 | $162,004 | $99,368 |
| 2016 | $2,630 | $256,248 | $158,828 | $97,420 |
| 2015 | $2,589 | $252,399 | $156,442 | $95,957 |
| 2014 | $2,541 | $247,455 | $153,377 | $94,078 |
Source: Public Records
Map
Nearby Homes
- 31261 Paseo Olivos
- 31121 Via Santo Tomas
- 31278 Calle San Juan Unit 12
- 31284 Calle San Juan Unit 14
- 26468 Calle San Antonio
- 30981 Via Mirador
- 31024 Calle San Diego Unit 94b
- 26447 Paseo Carmel Unit 11D
- 31377 Los Rios St Unit 64
- 30828 Calle Chueca
- 27381 Via Priorato
- 90 Plaza de Las Flores
- 31608 Los Rios St Unit 147
- 0 Aguacate Rd Unit 25558127
- 31527 Aguacate Rd
- 30532 Marbella Vista
- 27594 Starrise Ln
- 27703 Ortega Hwy Unit 13
- 27703 Ortega Hwy Unit 127
- 27591 Rolling Wood Ln
- 26745 Via el Socorro
- 26761 Via el Socorro
- 26741 Via el Socorro
- 26771 Via el Socorro
- 31096 Calle Santa Rosalia
- 31081 Via San Vicente
- 31092 Calle Santa Rosalia
- 26781 Via el Socorro
- 31091 Via San Vicente
- 26752 Via el Socorro
- 26746 Via el Socorro
- 26762 Via el Socorro
- 26742 Via el Socorro
- 31102 Calle Santa Rosalia
- 26772 Via el Socorro
- 31086 Calle Santa Rosalia
- 31077 Via San Vicente
- 26782 Via el Socorro
- 26732 Via el Socorro
- 31092 Via San Vicente