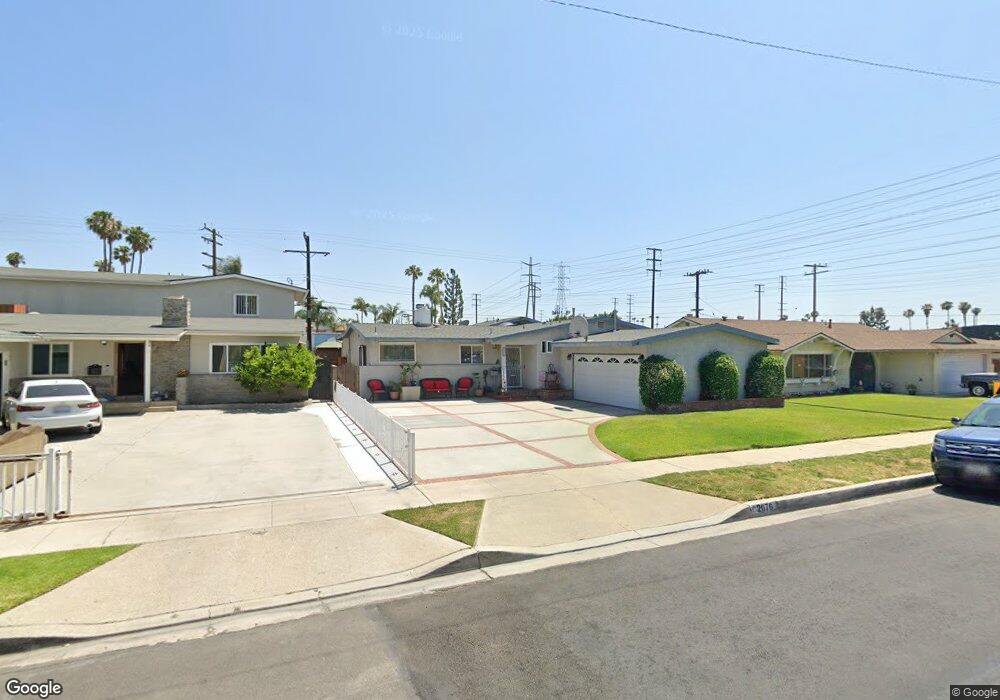
2676 W Yale Ave Anaheim, CA 92801
Northwest Anaheim NeighborhoodEstimated Value: $857,000 - $930,323
4
Beds
3
Baths
2,045
Sq Ft
$437/Sq Ft
Est. Value
About This Home
This home is located at 2676 W Yale Ave, Anaheim, CA 92801 and is currently estimated at $894,581, approximately $437 per square foot. 2676 W Yale Ave is a home located in Orange County with nearby schools including Juliette Low Elementary School, Dale Jr High School, and Savanna High School.
Ownership History
Date
Name
Owned For
Owner Type
Purchase Details
Closed on
Jun 14, 2024
Sold by
Spence Laura A and Spence James V
Bought by
Spence James V and Shewman-Spence Laura A
Current Estimated Value
Home Financials for this Owner
Home Financials are based on the most recent Mortgage that was taken out on this home.
Original Mortgage
$373,097
Outstanding Balance
$368,399
Interest Rate
7.09%
Mortgage Type
New Conventional
Estimated Equity
$526,182
Purchase Details
Closed on
Apr 17, 2003
Sold by
Shewman Greg L and Spence Laura A
Bought by
Spence James and Spence Laura A
Purchase Details
Closed on
Mar 15, 2000
Sold by
Lamorte Mark Patrick and Lamorte Christina Marie
Bought by
Shewman Greg L and Shewman Laura A
Home Financials for this Owner
Home Financials are based on the most recent Mortgage that was taken out on this home.
Original Mortgage
$206,121
Interest Rate
8.25%
Mortgage Type
FHA
Create a Home Valuation Report for This Property
The Home Valuation Report is an in-depth analysis detailing your home's value as well as a comparison with similar homes in the area
Home Values in the Area
Average Home Value in this Area
Purchase History
| Date | Buyer | Sale Price | Title Company |
|---|---|---|---|
| Spence James V | -- | Western Resources Title | |
| Spence James | -- | Commerce Title Co | |
| Shewman Greg L | $207,500 | -- |
Source: Public Records
Mortgage History
| Date | Status | Borrower | Loan Amount |
|---|---|---|---|
| Open | Spence James V | $373,097 | |
| Previous Owner | Shewman Greg L | $206,121 | |
| Closed | Spence James | $0 |
Source: Public Records
Tax History Compared to Growth
Tax History
| Year | Tax Paid | Tax Assessment Tax Assessment Total Assessment is a certain percentage of the fair market value that is determined by local assessors to be the total taxable value of land and additions on the property. | Land | Improvement |
|---|---|---|---|---|
| 2025 | $5,032 | $445,024 | $303,932 | $141,092 |
| 2024 | $5,032 | $436,299 | $297,973 | $138,326 |
| 2023 | $4,900 | $427,745 | $292,131 | $135,614 |
| 2022 | $4,851 | $419,358 | $286,403 | $132,955 |
| 2021 | $4,793 | $411,136 | $280,787 | $130,349 |
| 2020 | $4,766 | $406,921 | $277,908 | $129,013 |
| 2019 | $4,647 | $398,943 | $272,459 | $126,484 |
| 2018 | $4,589 | $391,121 | $267,117 | $124,004 |
| 2017 | $4,427 | $383,452 | $261,879 | $121,573 |
| 2016 | $4,404 | $375,934 | $256,744 | $119,190 |
| 2015 | $4,366 | $370,288 | $252,888 | $117,400 |
| 2014 | $4,147 | $363,035 | $247,934 | $115,101 |
Source: Public Records
Map
Nearby Homes
- 199 N Magnolia Ave Unit B
- 400 N Syracuse St
- 2709 W Madison Cir
- 2770 W Lincoln Ave Unit 29A
- 2770 W Lincoln Ave Unit 40
- 2770 W Lincoln Ave Unit 58
- 134 S Magnolia Ave Unit 4C
- 605 N La Reina St
- 2625 W Cameron Ct Unit 121
- 2871 W Tyler Ave
- 2955 W Lincoln Ave Unit 7
- 2513 W Fulcrum Place
- 2544 W Greenacre Ave
- 8319 Hickory Dr
- 2943 W Lincoln Ave
- 2550 W Rowland Ave
- 525 N Gilbert St Unit 106
- 525 N Gilbert St Unit 151
- 2432 W Transit Ave
- 507 S Shields Dr
- 2672 W Yale Ave
- 2702 W Yale Ave
- 2706 W Yale Ave
- 2668 W Yale Ave
- 2673 W Yale Ave
- 303 N La Reina St
- 2664 W Yale Ave
- 2669 W Yale Ave
- 307 N La Reina St
- 2665 W Yale Ave
- 121 N La Reina Cir
- 121 N La Reina Cir
- 2660 W Yale Ave
- 2672 W Bruce Ave
- 2668 W Bruce Ave
- 2661 W Yale Ave
- 311 N La Reina St
- 2656 W Yale Ave
- 2664 W Bruce Ave
- 2657 W Yale Ave