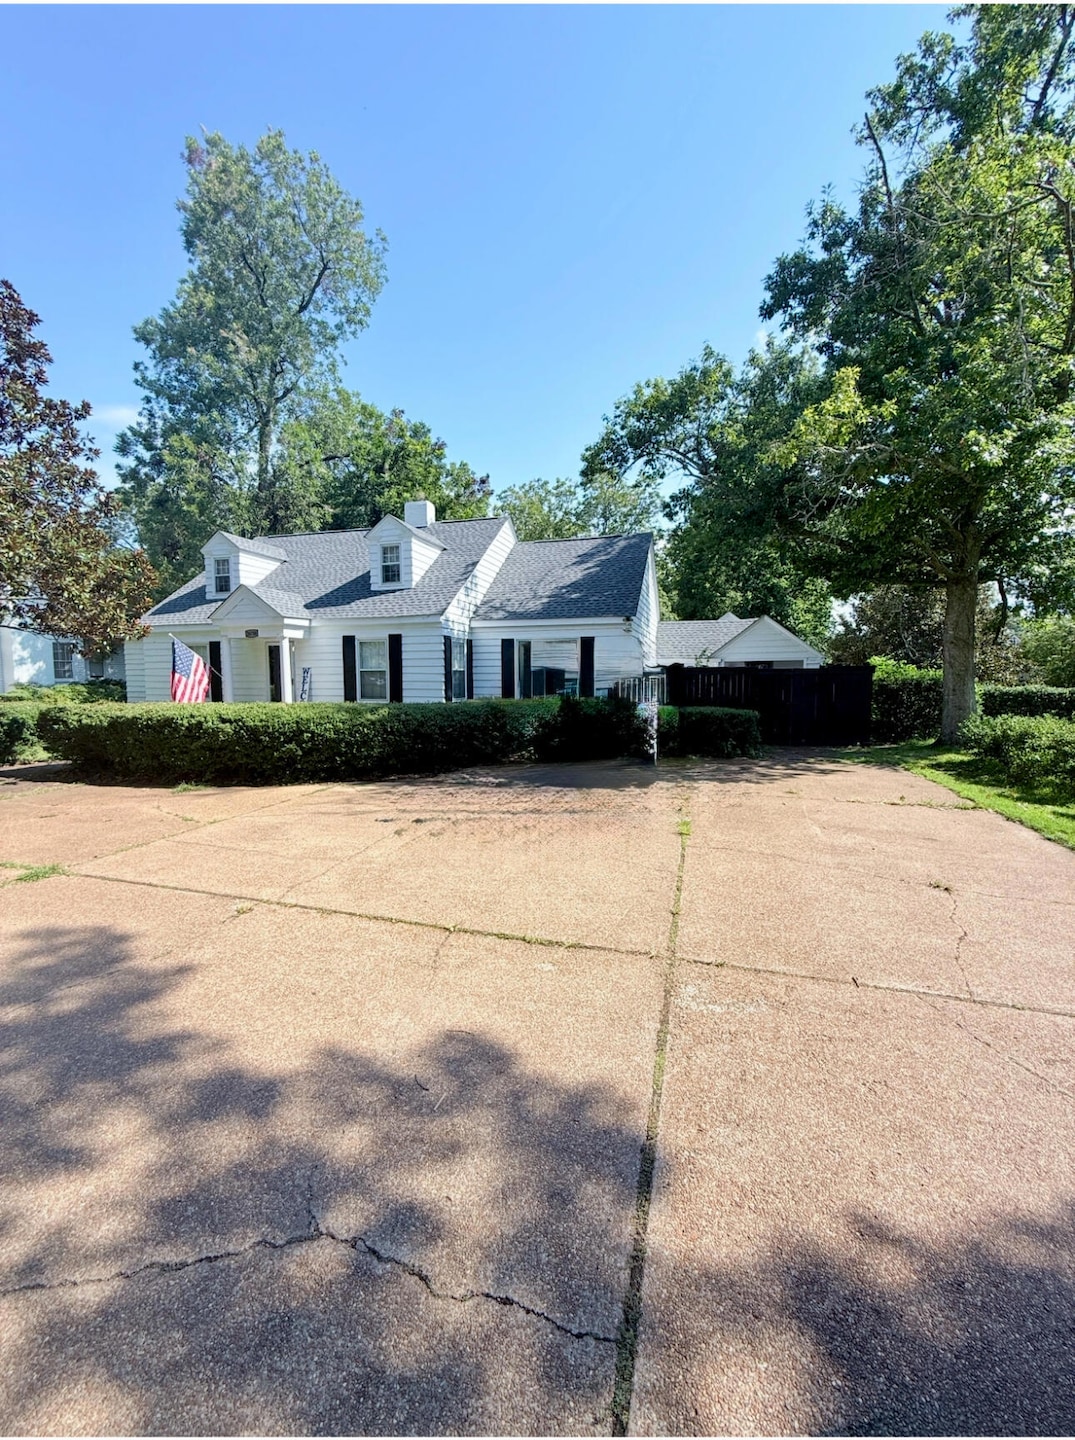
26788 E Main St West Point, MS 39773
Estimated payment $2,164/month
Highlights
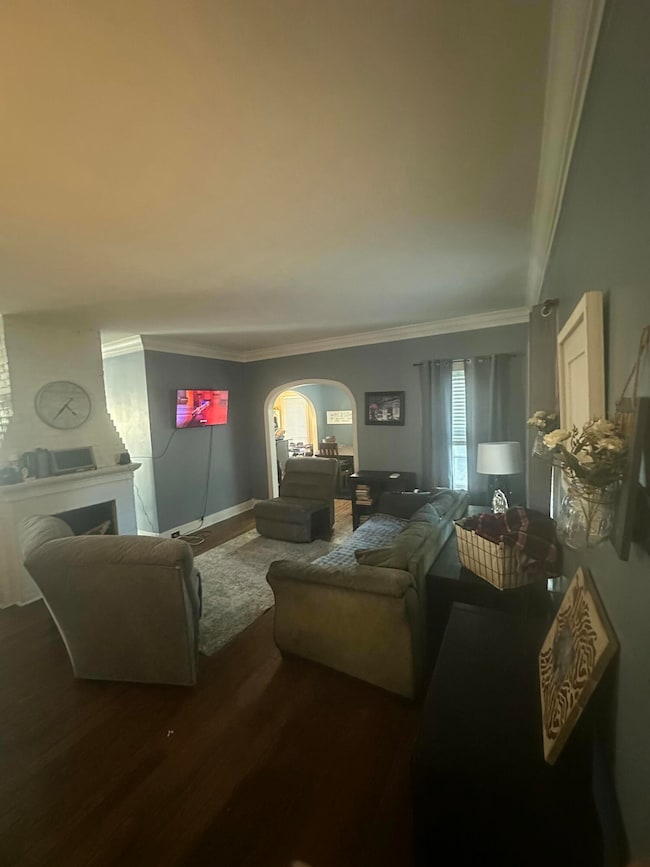
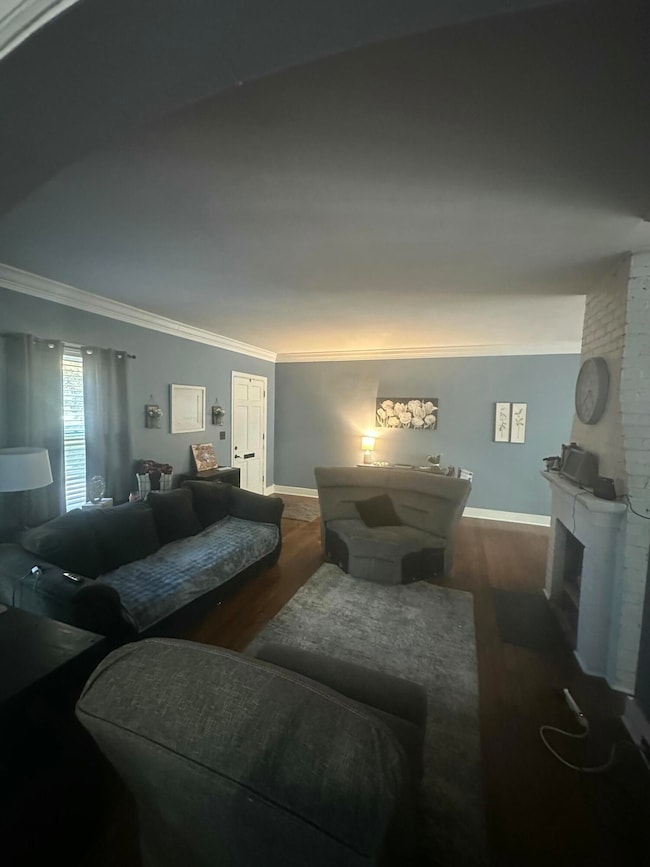
- Wood Flooring
- No HOA
- Fireplace
- Victorian Architecture
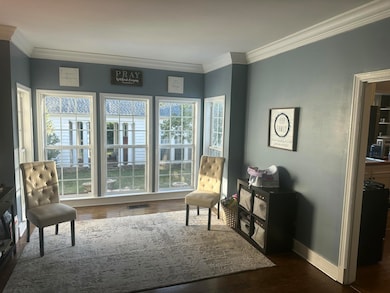
- Wood Frame Window
- 4-minute walk to Sally Kate Winter Memorial Park
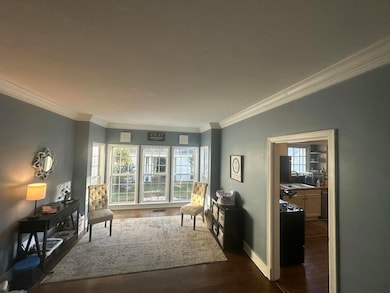
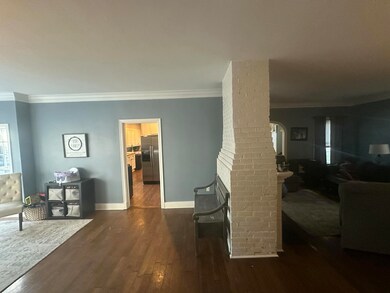
About This Home
Welcome to this one-of-a-kind West Point gem with over 3,700 sq ft of living space! The main home features 3 beds, 3 full baths, fresh paint, and a blend of hardwood, laminate, tile, and vinyl flooring. Enjoy double-pane windows and spacious, light-filled rooms. The separate 2-bed, 1-bath guest house includes a large walk-in shower, full kitchen, laundry, and generous living area—perfect for guests or extended family. You'll also love the dedicated office space, storage unit out back, new roof, and large fenced backyard. Close to downtown—shopping, dining & hospitals. Priced to sell!
Listing Agent
CRYE-LEIKE PROPERTIES UNLIMITED License #MS:S55805. AL:000146052-0 Listed on: 10/06/2025

Home Details
Home Type
- Single Family
Est. Annual Taxes
- $4,508
Year Built
- Built in 1940
Lot Details
- Lot Dimensions are 80 x 225
- Back Yard Fenced
Home Design
- Victorian Architecture
- Slab Foundation
- Architectural Shingle Roof
- Wood Siding
Interior Spaces
- 3,766 Sq Ft Home
- Ceiling Fan
- Fireplace
- Double Pane Windows
- Wood Frame Window
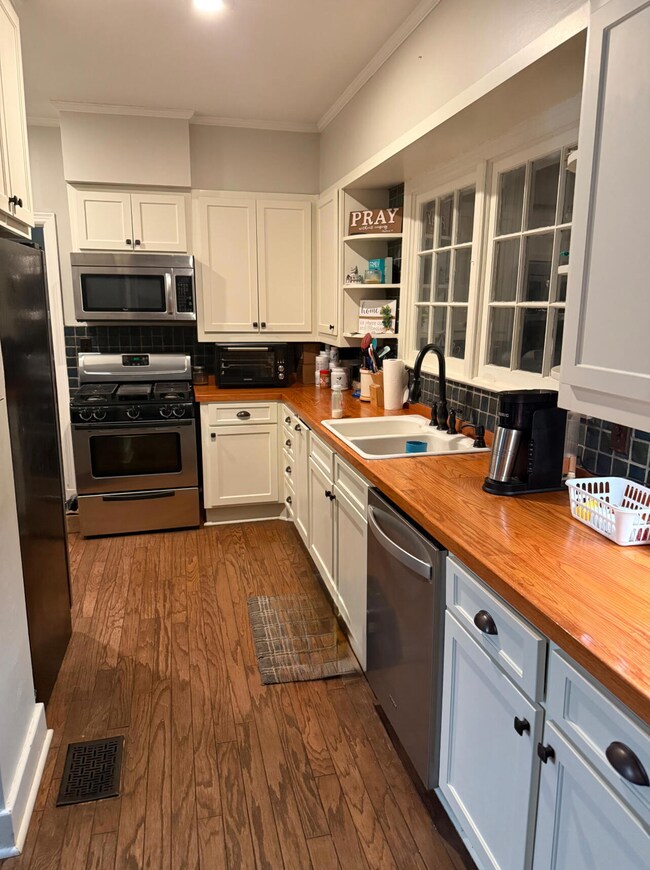
Kitchen
- Stove
- Dishwasher
- Disposal
Flooring
- Wood
- Tile
- Vinyl
Bedrooms and Bathrooms
- 5 Bedrooms
- 4 Full Bathrooms
Outdoor Features
- Rear Porch
Utilities
- Central Heating and Cooling System
- Gas Water Heater
Community Details
- No Home Owners Association
Listing and Financial Details
- Assessor Parcel Number 083C214A 0040000
Map
Tax History
| Year | Tax Paid | Tax Assessment Tax Assessment Total Assessment is a certain percentage of the fair market value that is determined by local assessors to be the total taxable value of land and additions on the property. | Land | Improvement |
|---|---|---|---|---|
| 2025 | $1,666 | $30,716 | $2,472 | $28,244 |
| 2024 | $1,666 | $30,716 | $2,472 | $28,244 |
| 2023 | $3,818 | $25,508 | $2,472 | $23,036 |
| 2022 | $1,391 | $25,508 | $2,472 | $23,036 |
| 2021 | $965 | $25,508 | $2,472 | $23,036 |
| 2020 | $969 | $20,584 | $2,472 | $18,112 |
| 2019 | $964 | $21,702 | $2,472 | $19,230 |
| 2018 | $926 | $21,702 | $2,472 | $19,230 |
| 2017 | $926 | $21,702 | $2,472 | $19,230 |
| 2016 | $902 | $21,702 | $2,472 | $19,230 |
| 2015 | $828 | $19,748 | $2,472 | $17,276 |
| 2014 | $636 | $19,748 | $2,472 | $17,276 |
| 2013 | $636 | $25,691 | $3,708 | $21,983 |
Property History
| Date | Event | Price | List to Sale | Price per Sq Ft |
|---|---|---|---|---|
| 01/05/2026 01/05/26 | Price Changed | $348,000 | -3.6% | $92 / Sq Ft |
| 11/17/2025 11/17/25 | Price Changed | $361,000 | -2.7% | $96 / Sq Ft |
| 10/06/2025 10/06/25 | For Sale | $371,000 | -- | $99 / Sq Ft |
Purchase History
| Date | Type | Sale Price | Title Company |
|---|---|---|---|
| Quit Claim Deed | -- | Vantage Point Title Inc | |
| Warranty Deed | -- | -- | |
| Warranty Deed | -- | -- |
Mortgage History
| Date | Status | Loan Amount | Loan Type |
|---|---|---|---|
| Open | $75,060 | New Conventional | |
| Previous Owner | $204,232 | New Conventional |
Source: Golden Triangle Association of REALTORS®
MLS Number: 25-2067
APN: 083C214A-0040000
- 26852 E Main St
- 26596 E Main St
- 479 E Westbrook St
- 485 E Westbrook St
- 1153 E Broad St
- 480 E Westbrook St
- 27045 E Main St
- 551 E Westbrook St
- 184 Tournament St
- 238 Calhoun St
- 530 E Morrow St
- 98 Court St
- 341 Mccord St
- 228 S Division St
- 761 E Morrow St
- 229 S Division St
- 228 Mccord St
- 507 S Eshman Ave
- 159 Washington St
- 1046 E Brame Ave
- 26944 E Main St Unit 11
- 1313 Saint Andrews Ln Unit 1313
- 1315 Saint Andrews Ln
- 781 Saint Andrews Ln
- 923 Muirfield Dr
- 919 Muirfield Dr
- 921 Muirfield Dr Unit Pop Inn
- 506 Holly Hills Rd
- 1033 Ms-182
- 300 Holly Hills Rd
- 285 Old Mayhew Rd Unit 5
- 940 Highway 12 E
- 102 Newbell Rd
- 127 Darby Way
- 125 Darby Way
- 704 Roundhouse Rd
- 1064 N Montgomery St Unit C
- 1064 N Montgomery St Unit Blue Diamond
- 904 N Montgomery St Unit 43
- 904 N Montgomery St Unit 68
Ask me questions while you tour the home.