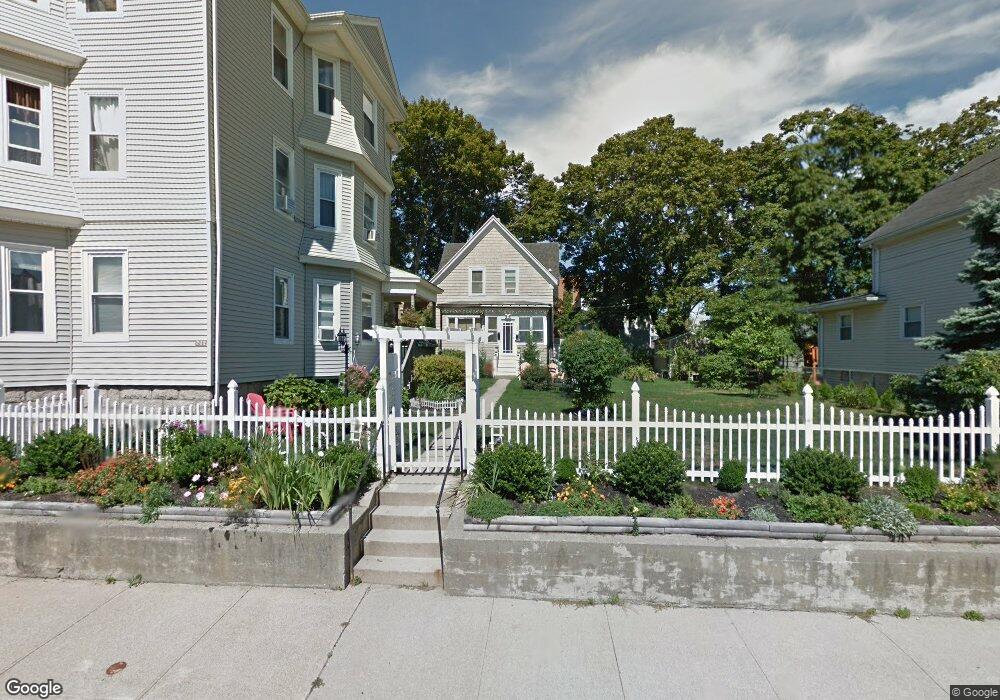
268 Ames St Fall River, MA 02721
Maplewood NeighborhoodEstimated Value: $314,000 - $598,000
2
Beds
2
Baths
968
Sq Ft
$443/Sq Ft
Est. Value
About This Home
This home is located at 268 Ames St, Fall River, MA 02721 and is currently estimated at $428,729, approximately $442 per square foot. 268 Ames St is a home located in Bristol County with nearby schools including Letourneau Elementary School, Matthew J. Kuss Middle School, and B M C Durfee High School.
Ownership History
Date
Name
Owned For
Owner Type
Purchase Details
Closed on
Mar 19, 2009
Sold by
Gendron Robert O and Gendron Louise
Bought by
Lio Daniel B
Current Estimated Value
Home Financials for this Owner
Home Financials are based on the most recent Mortgage that was taken out on this home.
Original Mortgage
$42,000
Outstanding Balance
$26,876
Interest Rate
5.25%
Mortgage Type
Purchase Money Mortgage
Estimated Equity
$401,853
Create a Home Valuation Report for This Property
The Home Valuation Report is an in-depth analysis detailing your home's value as well as a comparison with similar homes in the area
Home Values in the Area
Average Home Value in this Area
Purchase History
| Date | Buyer | Sale Price | Title Company |
|---|---|---|---|
| Lio Daniel B | $42,500 | -- |
Source: Public Records
Mortgage History
| Date | Status | Borrower | Loan Amount |
|---|---|---|---|
| Open | Lio Daniel B | $42,000 |
Source: Public Records
Tax History
| Year | Tax Paid | Tax Assessment Tax Assessment Total Assessment is a certain percentage of the fair market value that is determined by local assessors to be the total taxable value of land and additions on the property. | Land | Improvement |
|---|---|---|---|---|
| 2025 | $3,520 | $307,400 | $125,700 | $181,700 |
| 2024 | $3,259 | $283,600 | $120,900 | $162,700 |
| 2023 | $2,939 | $239,500 | $103,700 | $135,800 |
| 2022 | $2,701 | $214,000 | $94,300 | $119,700 |
| 2021 | $2,532 | $183,100 | $87,200 | $95,900 |
| 2020 | $2,319 | $160,500 | $83,500 | $77,000 |
| 2019 | $2,197 | $150,700 | $79,500 | $71,200 |
| 2018 | $2,095 | $143,300 | $78,000 | $65,300 |
| 2017 | $1,978 | $141,300 | $79,600 | $61,700 |
| 2016 | $1,949 | $143,000 | $82,900 | $60,100 |
| 2015 | $1,830 | $139,900 | $79,800 | $60,100 |
| 2014 | $1,881 | $149,500 | $84,000 | $65,500 |
Source: Public Records
Map
Nearby Homes
Your Personal Tour Guide
Ask me questions while you tour the home.