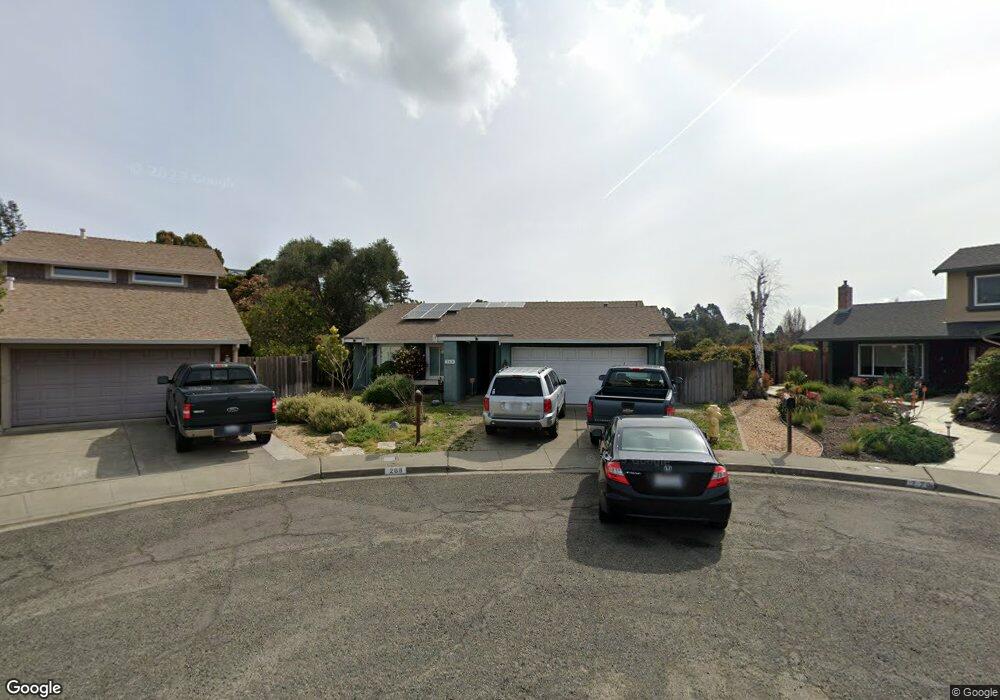
268 James Ct Benicia, CA 94510
Estimated Value: $769,000 - $868,000
3
Beds
2
Baths
1,365
Sq Ft
$601/Sq Ft
Est. Value
About This Home
This home is located at 268 James Ct, Benicia, CA 94510 and is currently estimated at $820,531, approximately $601 per square foot. 268 James Ct is a home located in Solano County with nearby schools including Joe Henderson Elementary School, Benicia Middle School, and Benicia High School.
Ownership History
Date
Name
Owned For
Owner Type
Purchase Details
Closed on
Jul 2, 2021
Sold by
Moriarty Marci Jean
Bought by
Moriarty Marci J
Current Estimated Value
Home Financials for this Owner
Home Financials are based on the most recent Mortgage that was taken out on this home.
Original Mortgage
$500,000
Outstanding Balance
$453,672
Interest Rate
2.9%
Mortgage Type
New Conventional
Estimated Equity
$366,859
Purchase Details
Closed on
Jul 12, 2006
Sold by
Hein Janet M
Bought by
Moriarty Marci Jean
Home Financials for this Owner
Home Financials are based on the most recent Mortgage that was taken out on this home.
Original Mortgage
$508,500
Interest Rate
6.87%
Mortgage Type
Purchase Money Mortgage
Purchase Details
Closed on
Mar 1, 2005
Sold by
Hein Larry A and Hein Janet M
Bought by
Hein Larry A and Hein Janet M
Create a Home Valuation Report for This Property
The Home Valuation Report is an in-depth analysis detailing your home's value as well as a comparison with similar homes in the area
Home Values in the Area
Average Home Value in this Area
Purchase History
| Date | Buyer | Sale Price | Title Company |
|---|---|---|---|
| Moriarty Marci J | -- | Old Republic Title Company | |
| Moriarty Marci Jean | $565,000 | North American Title Co | |
| Hein Larry A | -- | -- |
Source: Public Records
Mortgage History
| Date | Status | Borrower | Loan Amount |
|---|---|---|---|
| Open | Moriarty Marci J | $500,000 | |
| Closed | Moriarty Marci Jean | $508,500 |
Source: Public Records
Tax History Compared to Growth
Tax History
| Year | Tax Paid | Tax Assessment Tax Assessment Total Assessment is a certain percentage of the fair market value that is determined by local assessors to be the total taxable value of land and additions on the property. | Land | Improvement |
|---|---|---|---|---|
| 2025 | $8,787 | $756,969 | $301,446 | $455,523 |
| 2024 | $8,787 | $742,128 | $295,536 | $446,592 |
| 2023 | $8,574 | $727,578 | $289,742 | $437,836 |
| 2022 | $8,413 | $713,312 | $284,061 | $429,251 |
| 2021 | $7,452 | $633,000 | $208,000 | $425,000 |
| 2020 | $6,967 | $594,000 | $201,000 | $393,000 |
| 2019 | $7,268 | $618,000 | $216,000 | $402,000 |
| 2018 | $6,634 | $568,000 | $204,000 | $364,000 |
| 2017 | $5,986 | $515,000 | $190,000 | $325,000 |
| 2016 | $5,589 | $468,000 | $177,000 | $291,000 |
| 2015 | $5,494 | $465,000 | $177,000 | $288,000 |
| 2014 | $5,091 | $428,000 | $163,000 | $265,000 |
Source: Public Records
Map
Nearby Homes
- 327 Steven Cir
- 112 Inverness Ct
- 900 Southampton Rd Unit 45
- 900 Southampton Rd Unit 110
- 900 Southampton Rd Unit 138
- 900 Southampton Rd Unit 24
- 117 Sunset Cir Unit 37
- 117 Sunset Cir Unit 36
- 117 Sunset Cir Unit 34
- 432 Turner Dr
- 132 Chelsea Hills Dr
- 263 Carlisle Way
- 2016 Clearview Cir
- 253 Carlisle Way
- 543 Sandy Way
- 331 Larkin Dr
- 15 Buena Vista
- 212 Panorama Dr
- 919 W L St Unit 15
- 1130 W 9th St