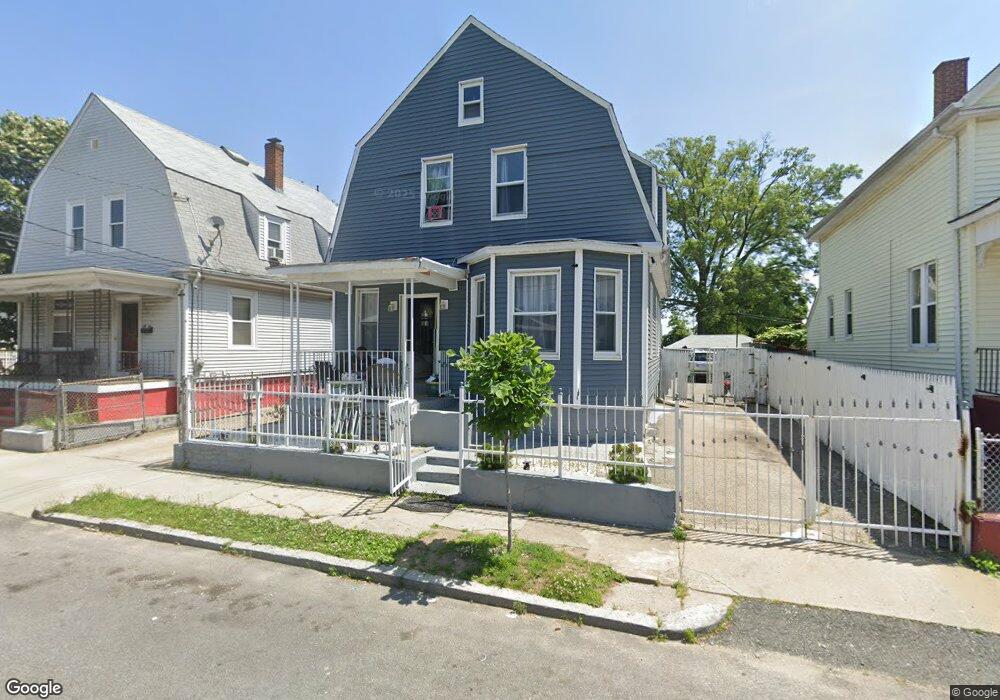
268 Oconnor St Providence, RI 02905
Washington Park NeighborhoodEstimated Value: $353,000 - $479,000
44
Beds
11
Baths
2,400
Sq Ft
$170/Sq Ft
Est. Value
About This Home
This home is located at 268 Oconnor St, Providence, RI 02905 and is currently estimated at $408,971, approximately $170 per square foot. 268 Oconnor St is a home located in Providence County with nearby schools including Asa Messer Elementary School, Charles N. Fortes Elementary School, and Alan Shawn Feinstein Elementary.
Ownership History
Date
Name
Owned For
Owner Type
Purchase Details
Closed on
Jan 14, 2022
Sold by
Peralta Doris
Bought by
Peralta-Vasquez Doris
Current Estimated Value
Home Financials for this Owner
Home Financials are based on the most recent Mortgage that was taken out on this home.
Original Mortgage
$234,432
Outstanding Balance
$215,495
Interest Rate
3.22%
Mortgage Type
FHA
Estimated Equity
$193,476
Purchase Details
Closed on
May 28, 2013
Sold by
Peralta Doris and Providence City Of
Bought by
Peralta Doris
Purchase Details
Closed on
Jun 1, 2001
Sold by
Botelho-Salamone Carol
Bought by
Peralta Doris
Purchase Details
Closed on
Jan 4, 1996
Sold by
Credit Northeast Inc
Bought by
Juste Jean and Montervil Mical
Create a Home Valuation Report for This Property
The Home Valuation Report is an in-depth analysis detailing your home's value as well as a comparison with similar homes in the area
Home Values in the Area
Average Home Value in this Area
Purchase History
| Date | Buyer | Sale Price | Title Company |
|---|---|---|---|
| Peralta-Vasquez Doris | -- | None Available | |
| Peralta-Vasquez Doris | -- | None Available | |
| Peralta-Vasquez Doris | -- | None Available | |
| Peralta Doris | $1,227 | -- | |
| Peralta Doris | $89,000 | -- | |
| Juste Jean | $65,000 | -- | |
| Peralta Doris | $1,227 | -- | |
| Peralta Doris | $89,000 | -- | |
| Juste Jean | $65,000 | -- |
Source: Public Records
Mortgage History
| Date | Status | Borrower | Loan Amount |
|---|---|---|---|
| Open | Peralta-Vasquez Doris | $234,432 | |
| Closed | Peralta-Vasquez Doris | $234,432 | |
| Previous Owner | Juste Jean | $216,000 | |
| Previous Owner | Juste Jean | $54,000 |
Source: Public Records
Tax History Compared to Growth
Tax History
| Year | Tax Paid | Tax Assessment Tax Assessment Total Assessment is a certain percentage of the fair market value that is determined by local assessors to be the total taxable value of land and additions on the property. | Land | Improvement |
|---|---|---|---|---|
| 2025 | $2,730 | $325,000 | $119,400 | $205,600 |
| 2024 | $4,376 | $238,500 | $75,600 | $162,900 |
| 2023 | $4,376 | $238,500 | $75,600 | $162,900 |
| 2022 | $4,245 | $238,500 | $75,600 | $162,900 |
| 2021 | $3,559 | $144,900 | $33,400 | $111,500 |
| 2020 | $3,559 | $144,900 | $33,400 | $111,500 |
| 2019 | $3,559 | $144,900 | $33,400 | $111,500 |
| 2018 | $3,509 | $109,800 | $30,300 | $79,500 |
| 2017 | $3,509 | $109,800 | $30,300 | $79,500 |
| 2016 | $3,509 | $109,800 | $30,300 | $79,500 |
| 2015 | $3,528 | $106,600 | $30,300 | $76,300 |
| 2014 | $3,598 | $106,600 | $30,300 | $76,300 |
| 2013 | $3,598 | $106,600 | $30,300 | $76,300 |
Source: Public Records
Map
Nearby Homes
- 268 O'Connor St
- 272 Oconnor St
- 264 Oconnor St
- 264 O Connor St
- 264 O'Connor St
- 274 O'Connor St
- 124 Porter St
- 274 Oconnor St
- 122 Porter St
- 280 O'Connor St
- 280 Oconnor St
- 261 Oconnor St
- 256 O'Connor St
- 256 Oconnor St
- 147 Johnson St
- 257 O'Connor St
- 118 Porter St
- 257 Oconnor St
- 275 Oconnor St
- 143 Johnson St