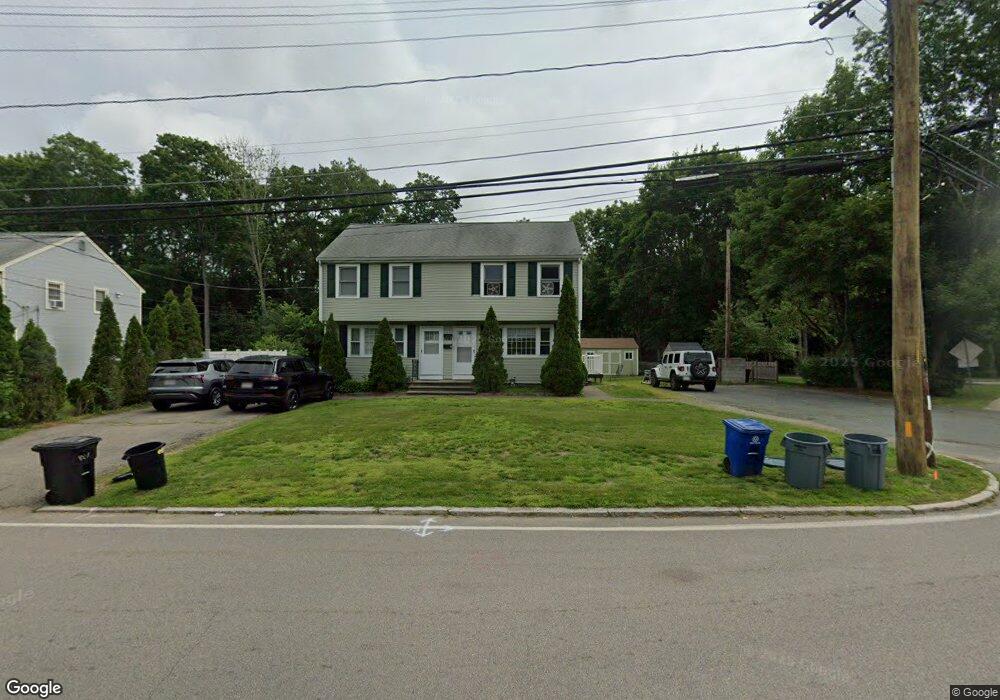
268 Stone St Walpole, MA 02081
Estimated Value: $693,000 - $786,000
4
Beds
2
Baths
1,800
Sq Ft
$413/Sq Ft
Est. Value
About This Home
This home is located at 268 Stone St, Walpole, MA 02081 and is currently estimated at $742,929, approximately $412 per square foot. 268 Stone St is a home located in Norfolk County with nearby schools including Boyden School, Eleanor N. Johnson Middle School, and Walpole High School.
Ownership History
Date
Name
Owned For
Owner Type
Purchase Details
Closed on
Sep 25, 2003
Sold by
Mclaughlin Builders In
Bought by
Rumbel Thomas P
Current Estimated Value
Home Financials for this Owner
Home Financials are based on the most recent Mortgage that was taken out on this home.
Original Mortgage
$295,000
Outstanding Balance
$135,107
Interest Rate
6.29%
Mortgage Type
Purchase Money Mortgage
Estimated Equity
$607,822
Create a Home Valuation Report for This Property
The Home Valuation Report is an in-depth analysis detailing your home's value as well as a comparison with similar homes in the area
Home Values in the Area
Average Home Value in this Area
Purchase History
| Date | Buyer | Sale Price | Title Company |
|---|---|---|---|
| Rumbel Thomas P | $400,000 | -- |
Source: Public Records
Mortgage History
| Date | Status | Borrower | Loan Amount |
|---|---|---|---|
| Open | Rumbel Thomas P | $295,000 |
Source: Public Records
Tax History
| Year | Tax Paid | Tax Assessment Tax Assessment Total Assessment is a certain percentage of the fair market value that is determined by local assessors to be the total taxable value of land and additions on the property. | Land | Improvement |
|---|---|---|---|---|
| 2025 | $8,120 | $632,900 | $334,700 | $298,200 |
| 2024 | $8,194 | $619,800 | $321,700 | $298,100 |
| 2023 | $8,234 | $592,800 | $279,800 | $313,000 |
| 2022 | $7,672 | $530,600 | $259,100 | $271,500 |
| 2021 | $7,508 | $505,900 | $244,400 | $261,500 |
| 2020 | $7,318 | $488,200 | $230,600 | $257,600 |
| 2019 | $6,700 | $443,700 | $221,800 | $221,900 |
| 2018 | $6,294 | $412,200 | $213,700 | $198,500 |
| 2017 | $6,134 | $400,100 | $205,500 | $194,600 |
| 2016 | $6,042 | $388,300 | $197,500 | $190,800 |
| 2015 | $5,864 | $373,500 | $188,000 | $185,500 |
| 2014 | $5,669 | $359,700 | $188,000 | $171,700 |
Source: Public Records
Map
Nearby Homes
- 224 School St Unit 9
- 222 School St Unit 9
- 50 Riverside Place
- 145 South St Unit 5
- 1110 Main St
- 37 Alice Ave
- 881 Main St Unit 9
- 6 Eleanor Rd
- 587 Common St
- 1 Merganser Way
- 56 North St
- 635 Old Post Rd Unit 303
- 635 Old Post Rd Unit 302
- 635 Old Post Rd Unit 2-203
- 1391 Main St Unit 308
- 1391 Main St Unit 306
- 1391 Main St Unit 304
- 486 Washington St
- 1 Palace Ct
- 1 Providence Hwy
- 268 Stone St Unit 1
- 268 Stone St Unit 2
- 264 Stone St
- 264 Stone St Unit Left
- 264 Stone St Unit Right
- 88 Massachusetts Ave
- 275 Stone St
- 16 Delcor Dr
- 12 Delcor Dr
- 8 Delcor Dr
- 4 Delcor Dr
- 8 Delcor Dr Unit 8
- 4 Delcor Dr Unit 4
- 262 Stone St
- 283 Stone St
- 92 Massachusetts Ave
- 261 Stone St
- 259 Stone St
- 257 Stone St
- 78 Massachusetts Ave
Your Personal Tour Guide
Ask me questions while you tour the home.