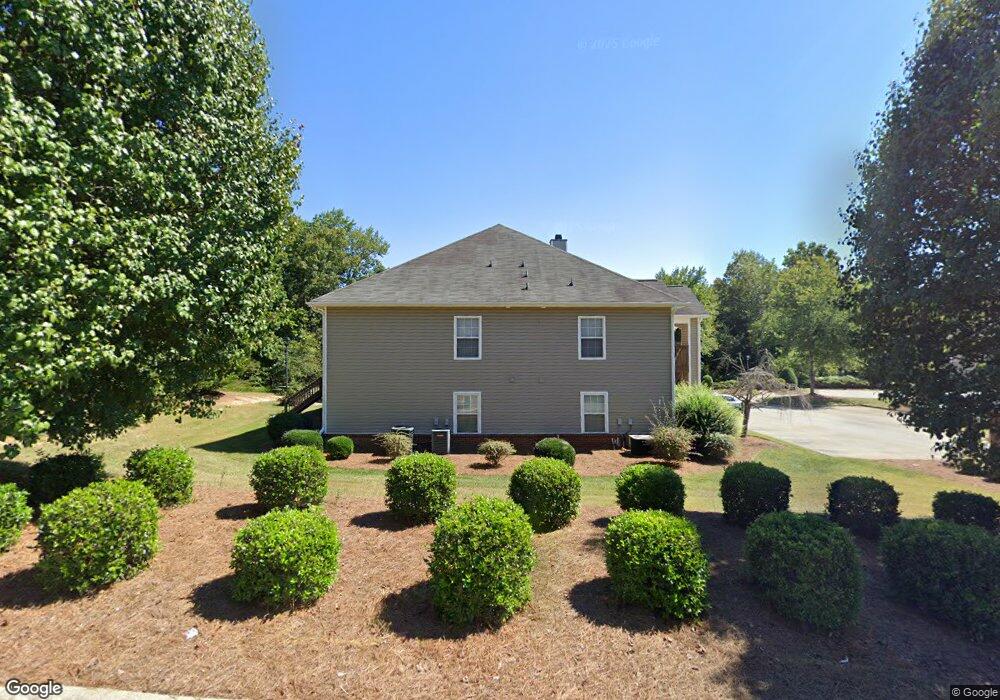
2680 Ingleside Dr Unit 1B High Point, NC 27265
Oak View NeighborhoodEstimated Value: $147,000 - $166,000
2
Beds
2
Baths
1,053
Sq Ft
$147/Sq Ft
Est. Value
About This Home
This home is located at 2680 Ingleside Dr Unit 1B, High Point, NC 27265 and is currently estimated at $155,143, approximately $147 per square foot. 2680 Ingleside Dr Unit 1B is a home located in Guilford County with nearby schools including Shadybrook Elementary School, Ferndale Middle School, and High Point Central High School.
Ownership History
Date
Name
Owned For
Owner Type
Purchase Details
Closed on
Mar 28, 2025
Sold by
Stevens Gaye O and Stevens Tamia Nicole
Bought by
Stevens Tamia Nicole
Current Estimated Value
Purchase Details
Closed on
Jan 22, 2006
Sold by
Kindley Cristi Campbell and Kindley Kenneth A
Bought by
Stevens Gaye O
Home Financials for this Owner
Home Financials are based on the most recent Mortgage that was taken out on this home.
Original Mortgage
$67,150
Interest Rate
6.22%
Mortgage Type
Fannie Mae Freddie Mac
Purchase Details
Closed on
Oct 25, 1999
Sold by
The Hamilton Group Of High Point Llc
Bought by
Campbell Cristi Lynn
Home Financials for this Owner
Home Financials are based on the most recent Mortgage that was taken out on this home.
Original Mortgage
$78,600
Interest Rate
7.81%
Mortgage Type
Purchase Money Mortgage
Create a Home Valuation Report for This Property
The Home Valuation Report is an in-depth analysis detailing your home's value as well as a comparison with similar homes in the area
Home Values in the Area
Average Home Value in this Area
Purchase History
We collect this data history from publicly available records. To have your information removed, we recommend requesting removal directly through your county’s website.
| Date | Buyer | Sale Price | Title Company |
|---|---|---|---|
| Stevens Tamia Nicole | -- | None Listed On Document | |
| Stevens Tamia Nicole | -- | None Listed On Document | |
| Stevens Gaye O | $79,000 | None Available | |
| Campbell Cristi Lynn | $83,000 | -- |
Source: Public Records
Mortgage History
We collect this data history from publicly available records. To have your information removed, we recommend requesting removal directly through your county’s website.
| Date | Status | Borrower | Loan Amount |
|---|---|---|---|
| Previous Owner | Stevens Gaye O | $67,150 | |
| Previous Owner | Campbell Cristi Lynn | $78,600 |
Source: Public Records
Tax History
| Year | Tax Paid | Tax Assessment Tax Assessment Total Assessment is a certain percentage of the fair market value that is determined by local assessors to be the total taxable value of land and additions on the property. | Land | Improvement |
|---|---|---|---|---|
| 2025 | $1,062 | $77,100 | $18,000 | $59,100 |
| 2024 | $1,062 | $77,100 | $18,000 | $59,100 |
| 2023 | $1,062 | $77,100 | $18,000 | $59,100 |
| 2022 | $1,039 | $77,100 | $18,000 | $59,100 |
| 2021 | $947 | $68,700 | $14,000 | $54,700 |
| 2020 | $947 | $68,700 | $14,000 | $54,700 |
| 2019 | $947 | $68,700 | $0 | $0 |
| 2018 | $942 | $68,700 | $0 | $0 |
| 2017 | $947 | $68,700 | $0 | $0 |
| 2016 | $1,088 | $77,600 | $0 | $0 |
| 2015 | $1,094 | $77,600 | $0 | $0 |
| 2014 | $1,113 | $77,600 | $0 | $0 |
Source: Public Records
Map
Nearby Homes
- 2703 Camillia Cove
- 2705 Camillia Cove
- 752 Celtic Crossing Dr
- 744 Celtic Crossing Dr
- 652 Switchback Ct
- 2218 Shadow Valley Rd Unit B
- 2215 Shadow Valley Rd Unit H
- 2214 Shadow Valley Rd Unit E
- 5430 Forester Dr Unit 3D
- 5828 Election Oak Dr
- 1052 Glyn Water Ln
- 1001 Nuthatch Ct
- 106 Brinkley Place
- 506 Greenwood Dr
- 1718 Farnsworth Ct
- 101 Oxford Place Unit 19
- 1700 Farnsworth Ct
- 125 Bellevue Dr
- 3300 N Main St
- 220 Hedgecock Rd
- 2660- 2D Ingleside Dr Unit 2D
- 2660- 2D Ingleside Dr
- 2660 Ingleside Dr Unit 1A
- 2660 Ingleside Dr Unit 2A
- 2660 Ingleside Dr Unit 1B
- 2660 Ingleside Dr Unit 2B
- 2660 Ingleside Dr Unit 1C
- 2660 Ingleside Dr Unit 2C
- 2660 Ingleside Dr Unit 1D
- 2660 Ingleside Dr Unit 2D
- 2660 Ingleside Dr
- 2670 Ingleside Dr Unit 1A
- 2670 Ingleside Dr Unit 2A
- 2670 Ingleside Dr Unit 1B
- 2670 Ingleside Dr Unit 2B
- 2670 Ingleside Dr Unit 1C
- 2670 Ingleside Dr Unit 1D
- 2670 Ingleside Dr Unit 2D
- 2670 Ingleside Dr
- 2680 Ingleside Dr Unit 2D
Your Personal Tour Guide
Ask me questions while you tour the home.